Agent dashboard in historical analytics
Important
This feature is intended to help customer service managers or supervisors enhance their team's performance and improve customer satisfaction. This feature is not intended for use in making, and should not be used to make, decisions that affect the employment of an employee or group of employees, including compensation, rewards, seniority, or other rights or entitlements. Customers are solely responsible for using Dynamics 365 Customer Service, this feature, and any associated feature or service in compliance with all applicable laws, including laws relating to accessing individual employee analytics and monitoring, recording, and storing communications with end users. This also includes adequately notifying end users that their communications with agents may be monitored, recorded, or stored and, as required by applicable laws, obtaining consent from end users before using the feature with them. Customers are also encouraged to have a mechanism in place to inform their agents that their communications with end users may be monitored, recorded, or stored.
The Agent dashboard shows charts and KPIs that you can use to guide agents and understand overall agent performance.
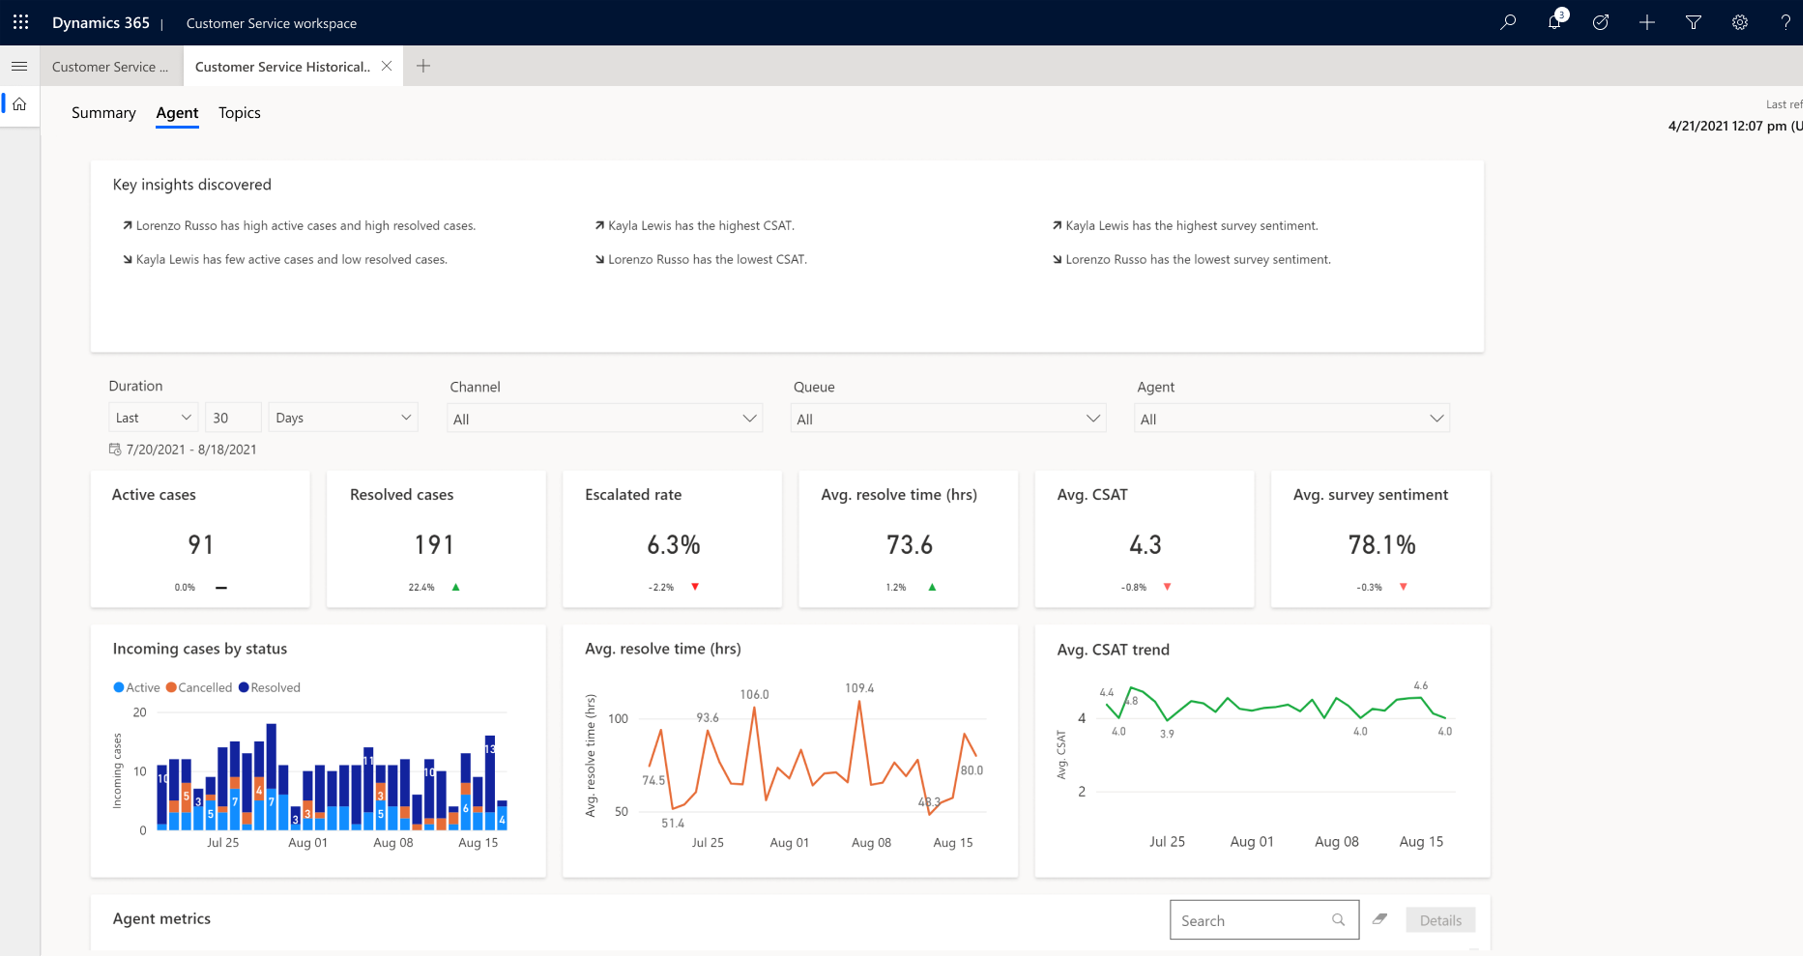
To view the Agent dashboard, go to Customer Service historical analytics and select Agent at the top of the workspace. The dashboard shows charts and KPIs for individual agents and overall agent performance, and includes the following insights:

Access the Agent dashboard
In the Customer Service workspace or Omnichannel for Customer Service app, do one of the following to view the dashboard:
- In the default view, select the plus (+) icon, and then select Customer Service historical analytics.
- If the enhanced multisession workspace view is enabled, select the site map and then select Customer Service historical analytics.
On the page that appears, select the dashboard.
Report details
The reports summarize the key performance indicators for the specified time period and the percent change over the period. You can filter these areas by duration, channel, queue, agent conversation, and timezone. The KPIs for the dashboard are displayed as seen in the following screenshot.

The following table displays the key performance indicators in the agent report.
| KPI | Description |
|---|---|
| Active cases | The number of cases that are currently open. |
| Resolved cases | The number of cases closed by an agent. |
| Escalated cases | The percentage of cases that needed to be escalated. |
| Average resolve time | The average time taken by an agent to resolve the case. |
| Average CSAT | The average customer satisfaction score, based on written feedback submitted by the customer in the Customer Voice survey. |
| Average survey sentiment | The average sentiment score, based on written feedback submitted by the customer in the Customer Voice survey. |
The agent dashboard has charts that have the following metrics.
| KPI | Description |
|---|---|
| Case volume over duration | Day-over-day trend of case volume. |
| Average resolve time | Month-over-month trend of case resolution time in minutes. |
| CSAT and survey sentiment by agent | Agent-focused view comparing CSAT and sentiment from Customer Voice survey responses. |
| Agent metrics | Overview of core agent metrics in relation to other metrics and date. |
Agent drill down view
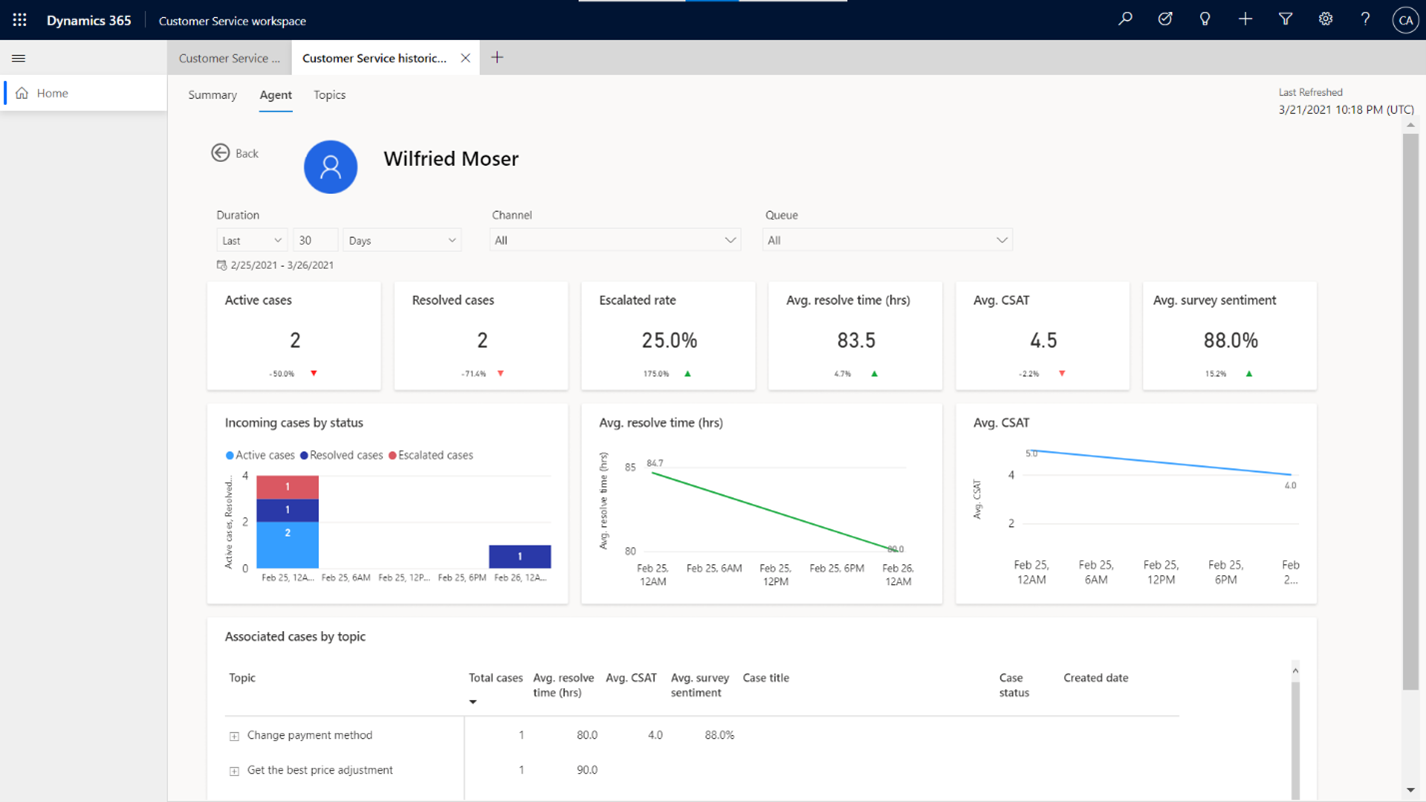
The Agent drill down view provides supervisors with a holistic look into individual agent performance on metrics and can be valuable in training scenarios for agents.
To access the drill down report, select any metric value for the required agent, and then select Details.

Note
Agent availability (start and end time) is only available in UTC, and isn't affected by the user's time zone.
See also
Dashboard overview
Summary dashboard
Topics dashboard
Manage report bookmarks
Feedback
Coming soon: Throughout 2024 we will be phasing out GitHub Issues as the feedback mechanism for content and replacing it with a new feedback system. For more information see: https://aka.ms/ContentUserFeedback.
Submit and view feedback for