Audit and diagnostics overview
The Audit & Diagnostics Settings area provides centralized management for agent auditing and Unified Service Desk application diagnostic logging.
Agent auditing helps organizations analyze agent productivity, identify gaps in process, and provide coaching and training that can all be used to further improve the customer service experience. Audit data in Unified Service Desk is channeled to a listener that gives you control over where you channel audit logging, such as to a text file, windows event log, or data store.
Diagnostic logging helps you troubleshoot issues that may occur with the Unified Service Desk application.
When you configure auditing and diagnostics in Unified Service Desk, keep in mind the following functionality:
How Unified Service Desk auditing and diagnostics are configured and recorded is completely separate from the audit feature in Microsoft Dataverse.
Unified Service Desk auditing requires a Listener Hosted Control to record and save audit activity. Similarly, you can channel diagnostic logging using a Listener Hosted Control, but it’s not required, and by default, diagnostic logging is recorded on the local computer.
Audit and diagnostics configuration overview
Developer writes the code used for the custom listener. Typically, the custom listener is an assembly. More information: Create custom listeners for auditing, diagnostics and traces
Developer compresses the assembly into a .zip package file. More information: Create custom listeners for auditing, diagnostics and traces
Developer creates the Listener Hosted Control, which includes information about the assembly created in step 1. More information: Listener Hosted Control (Hosted Control)
Unified Service Desk administrator creates an Audit & Diagnostics Settings record that defines what is audited or diagnosed. Additionally, the Listener Hosted Control is associated with the Audit & Diagnostics Settings record. More information: Auditing
Unified Service Desk administrator creates a Customization Files record and attaches the .zip package file that was created by the developer in the previous step. More information: Distribute custom hosted controls using Customization Files
Unified Service Desk administrator associates the Customization Files record with the appropriate Configuration. More information: Assign users to a Unified Service Desk configuration
Auditing
You can configure auditing in Unified Service Desk in one of two ways:
Standard or custom auditing using an Audit & Diagnostics record. This audit feature is centrally managed, has several events to choose from, and allows you to add a custom listener that determines where audit data is sent.
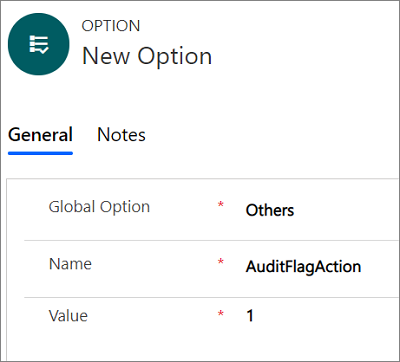
Standard auditing by adding an audit flag and setting its value to 1 in the Options area. This audit feature has limited events and logs audit data in the UII_auditBase table in the organization database.
Note
If you enable both an Audit & Diagnostics record and an audit flag option record, the audit flag option record will be ignored and will not record audit data.
Create an Audit & Diagnostics record to use for auditing
Note
The procedure guides you to configure both auditing and diagnostics in a single record. Although you can configure individual records for auditing and diagnostics in the Audit & Diagnostics Settings record.
Sign in to the Dynamics 365 instance.
Select the down arrow next to Dynamics 365.
Select Unified Service Desk Administrator.
Select Audit & Diagnostics Settings under Advanced Settings in the site map.
Select + New in the Active Audit & Diagnostics Settings page.
Type a name in the Name field. The name describes the purpose of the Audit & Diagnostics record, such as All events auditing and Diagnostics information-level logging.
Select Audit Settings tab and select the Activity Tracking Enabled check box.
This example is for tracking all events, so when you select Activity Tracking Enabled, all the check boxes are selected. Alternatively, you can clear the check box for any events you don’t want to audit for this record.
You can also include diagnostics logging in this record. For more information see step 9.
Select Save to select the record. After saving the record, you can start updating the diagnostics settings.
Note
Audit and diagnostics settings records are activated when they are created.
Select Diagnostics Settings and specify the following.
Field Value Enable Exit Monitoring By default, exit monitoring is enabled and both diagnostics logs and exit logs are collected in the event of an exception in the Unified Service Desk client. Diagnostics Logs Directory Specifies the full path to the folder where diagnostics files for exceptions are kept. If the path is invalid or inaccessible, Unified Service Desk will use the default folder. By default, the folder is %APPDATA%\Roaming\Microsoft\Microsoft Dynamics 365 Unified Service Desk\<version>\Diagnostics\.On-Demand Diagnostics Shortcut Specifies the shortcut key used to invoke the manual creation of a dump file. The default key combination is CTRL+ALT+A. To change the default, use the form key1+key2+key3.
Note:
You can start the manual creation of a dump file using the On-Demand Diagnostics Shortcut key only when Enable Exit Monitoring or Enable Crash Dump Generation, or both options are enabled.Diagnostics Verbosity Level Determines the type of events that will be recorded during diagnostics. The default value is error level.
- Error: Reports only error events.
- Warning: Reports errors and warning events.
- Information: Reports errors, warnings, and information events.
- Verbose: Reports errors, warnings, information, and verbose events.
Enable Crash Dump Generation The default is enabled and dump files are collected during a fatal exception of the Unified Service Desk client. If the options is not set dump files will not be collected during a Unified Service Desk client exception. If this options is disabled and Enable Exit Monitoring is enabled, both diagnostics logs and exit logs are collected, but dump files aren’t. Max Diagnostics Logs Size (MB) Specifies the maximum size of the folder in megabytes where diagnostics files are kept. The default size is 5 GB (5000 MB). When the specified value is exceeded, the oldest log folders will be deleted until the folder size no longer exceeds the value. Notice that, the most recent log folder is not deleted even if it exceeds the value specified. Retain the values for the On-Demand Begin Shortcut and On-Demand End Shortcut. To learn more, see Generate performance data logs (Performance data collection).
Add a Trace Source Setting record in the Trace Source Settings section. The Trace Source Setting includes the Listener Hosted Control that is used to channel the audit and diagnostic activity to a data store, event log, or text file. To create a Trace Source Setting record, follow these steps.
Important
You must provide a Trace Source Setting record that contains a valid Listener Hosted Control that will be used to record the audit activity, or the audit activity will not be saved. For information about how to create a Listener Hosted Control, see Create custom listeners for auditing, diagnostics and traces.
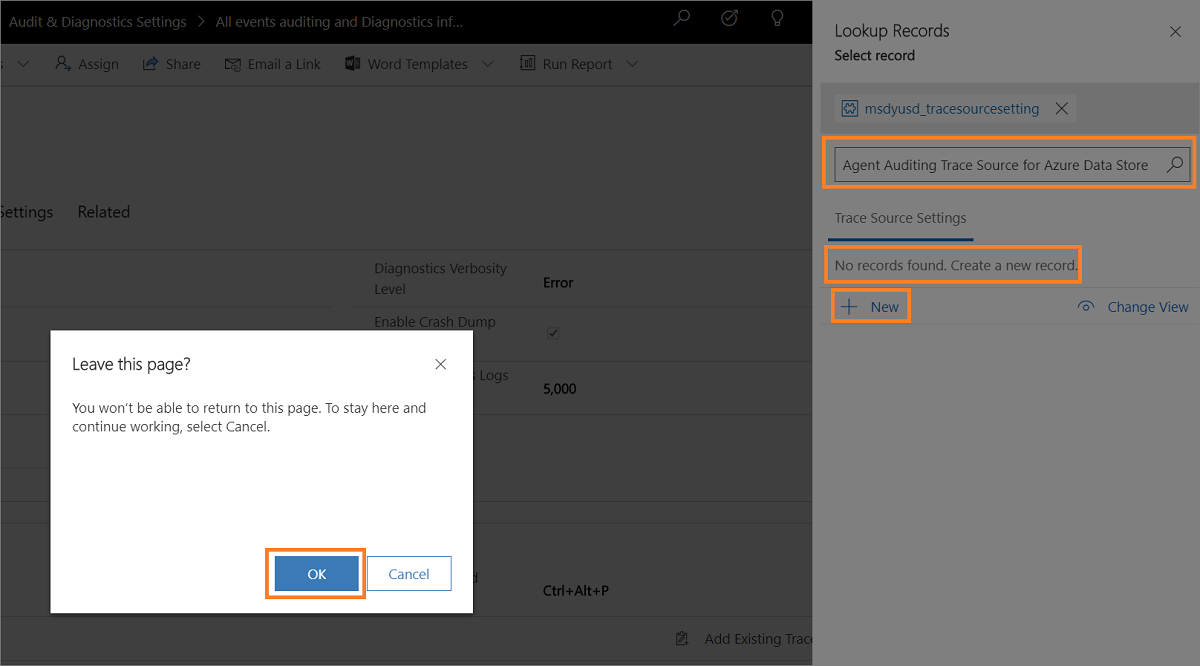
Select Add Existing Trace Setting in the Trace Source Settings section. The Lookup Records pane appears.

Type the name to search for the Trace Source Settings record. If the record is not available, you must select + New to create a new trace source setting page. When you select + New, a confirmation dialog appears. Ensure that you've saved the record before leave the page. Now, when you select OK, the New Trace Source Setting page appears.

- Type the source name such as Agent Auditing Trace Source for Azure Data Store.

Select Save. After you save the trace source setting record, the Listener Hosted Controls section appears.
Retain the value of Switch as Error. Error is the default value.
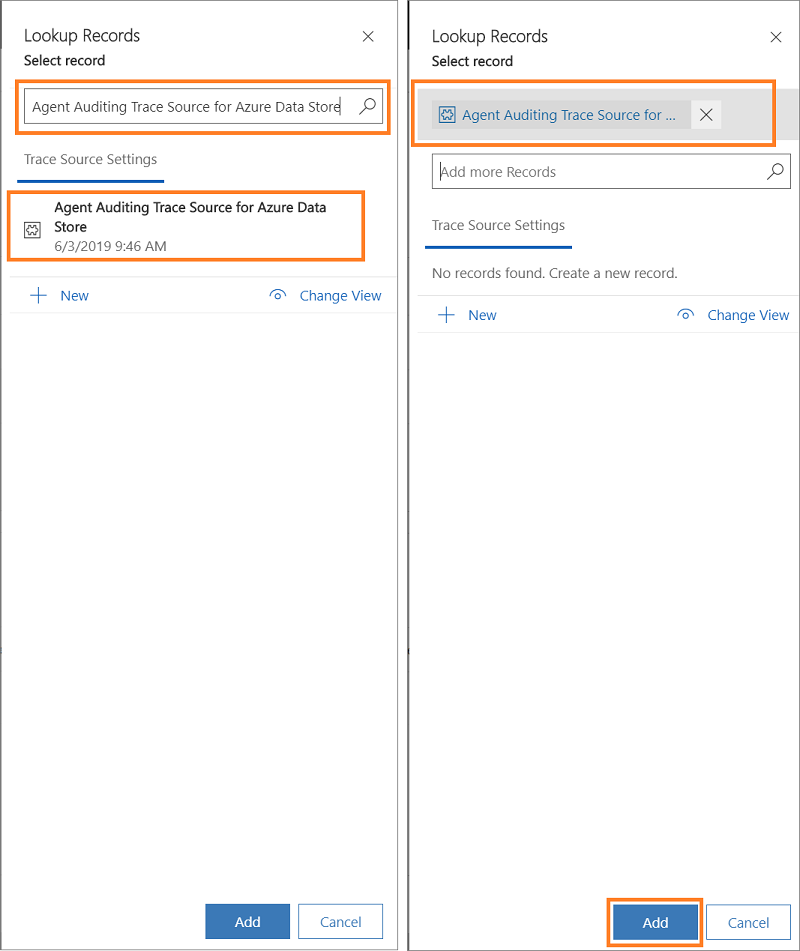
Select Add Existing Hosted Control in the Listener Hosted Controls section. The Lookup Records pane appears.
Type the name of the hosted control that will be used for agent auditing, and choose the hosted control from the list, and then select Add.
Select Save.
After you create the trace source setting, select Auditing & Diagnostics Settings in the site map and select the auditing and diagnostics record.
Select Diagnostics Settings tab and select Add Existing Trace Setting in the Trace Source Settings section. The Lookup Records pane appears. Type the name of trace source setting record you created in the search box, and select Add.

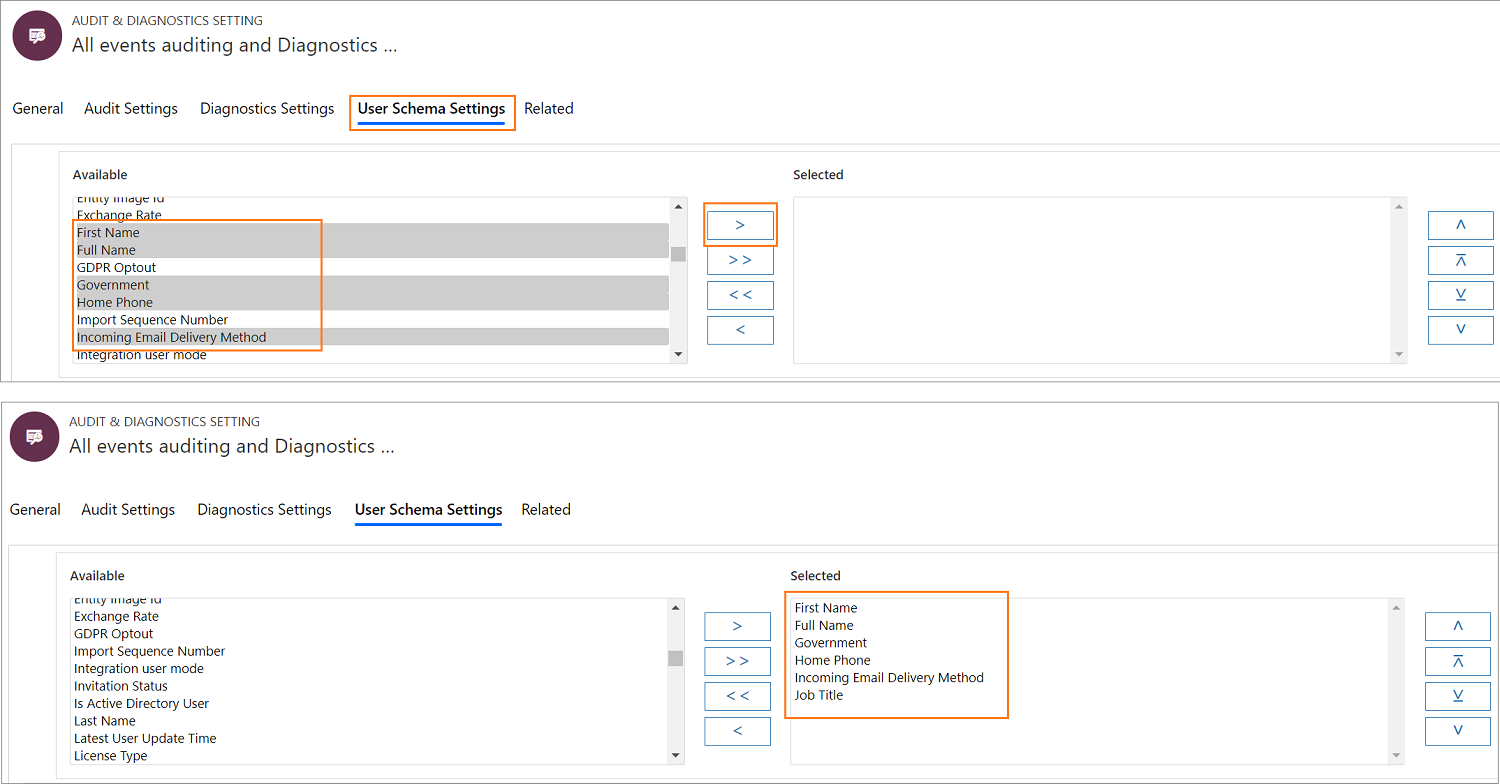
Select the User Schema Settings tab.
Select the user entities and select the > to add.

Select Save to save the Audit & Diagnostics record.
Next, to begin audit logging, associate the audit & diagnostic record with a configuration. To do this, create a configuration or use an existing configuration. Select configuration in the site map and then select the a record from the list of the configuration.
Type the name of the audit and diagnostic record in the Audit & Diagnostics Settings field, and then Select Save to save the configuration record. To learn more, see Manage access using Unified Service Desk configuration
Standard auditing by adding an audit flag
Sign in to the Dynamics 365 instance.
Select the down arrow next to Dynamics 365.
Select Unified Service Desk Administrator.
Select Options under Advance Settings in the sitemap.
Select New in the Active UII Options page.
Type an audit flag name in the Name field and an appropriate value in the Value field.

You can use the audit flags listed in this table.
Audit flag Description AuditCacheMaxSize When this flag value is set to 1, the number of audit records cached before saving to the server is 1 record.
This option works only if the AuditNoCache is False.AuditFlagAction When this flag value is set to 1, audit records are created when an action is fired. AuditFlagAgentState When this flag value is set to 1, audit files are created when the status of the agent changes. AuditFlagHostedApplication When this flag value is set to 1, audit files are created when a hosted application is started or gets focus. AuditFlagLogin When this flag value is set to 1, audit records are created when an agent logs in. AuditFlagSession When this flag value is set to 1, audit records are created when a session is created or there is a session switch. AuditFlagWorkflow When this flag value is set to 1, audit records are created when a UII workflow is started or closed. AuditNoCache If this is set to True, audit records are saved dynamically to the server without any caching. Select Save.
To view audit logging, sign in to the Dynamics 365 instance, and then from a productivity area select Advanced Find. In the Look for list, select
UII Audit, and then select Results to see all audit logging details.
Deactivate or activate an Audit & Diagnostics Settings record
Deactivate a record
Sign in to the Dynamics 365 instance.
Select the down arrow next to Dynamics 365.
Select Unified Service Desk Administrator.
Select Audit & Diagnostics Settings under Advanced Settings in the site map.
Select the record you want to deactivate from the Active Audit & Diagnostics Settings view.
Select Deactivate on the toolbar.
Select Deactivate in the Confirm Deactivation dialog.
The audit and diagnostics record is deactivated.
Activate a record
Sign in to the Dynamics 365 instance.
Select the down arrow next to Dynamics 365.
Select Unified Service Desk Administrator.
Select Audit & Diagnostics Settings under Advanced Settings in the site map.
Select the v down arrow next to Active Audit & Diagnostics Settings and choose Inactive Audit & Diagnostics Settings.
Select the record you want to deactivate from the Inactive Audit & Diagnostics Settings view.
Select Activate on the toolbar.
Select Activate in the Confirm Audit & Diagnostics Setting Activation dialog.
The audit and diagnostics record is activated.
See also
Manage Options for Unified Service Desk
Global Manager (Hosted Control)
Administer and manage overview
Performance data collection using keyboard shortcut
Feedback
Coming soon: Throughout 2024 we will be phasing out GitHub Issues as the feedback mechanism for content and replacing it with a new feedback system. For more information see: https://aka.ms/ContentUserFeedback.
Submit and view feedback for