Azure Monitor Logs overview
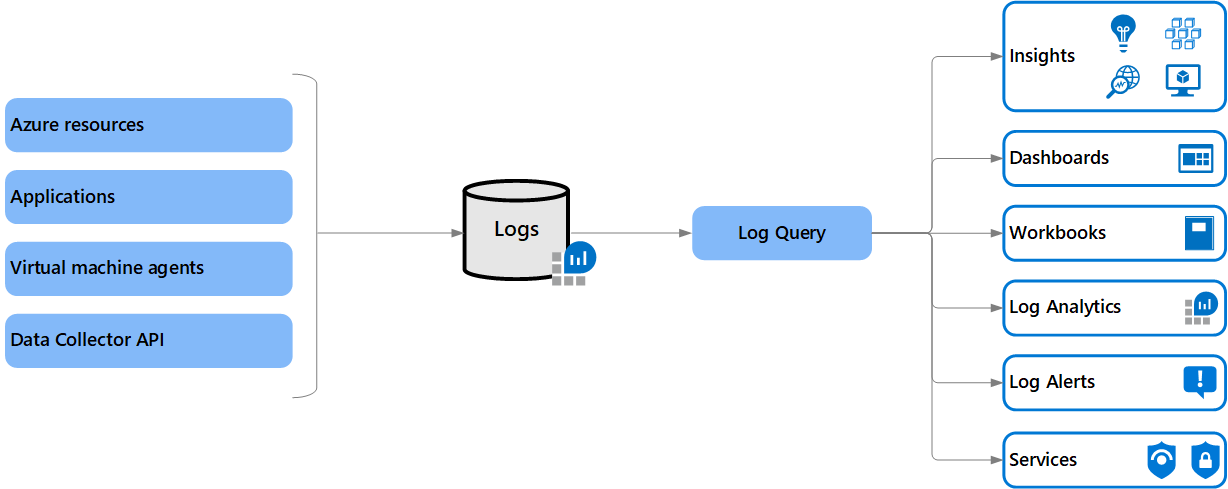
Azure Monitor Logs is a feature of Azure Monitor that collects and organizes log and performance data from monitored resources. Several features of Azure Monitor store their data in Logs and present this data in various ways to assist you in monitoring the performance and availability of your cloud and hybrid applications and their supporting components.
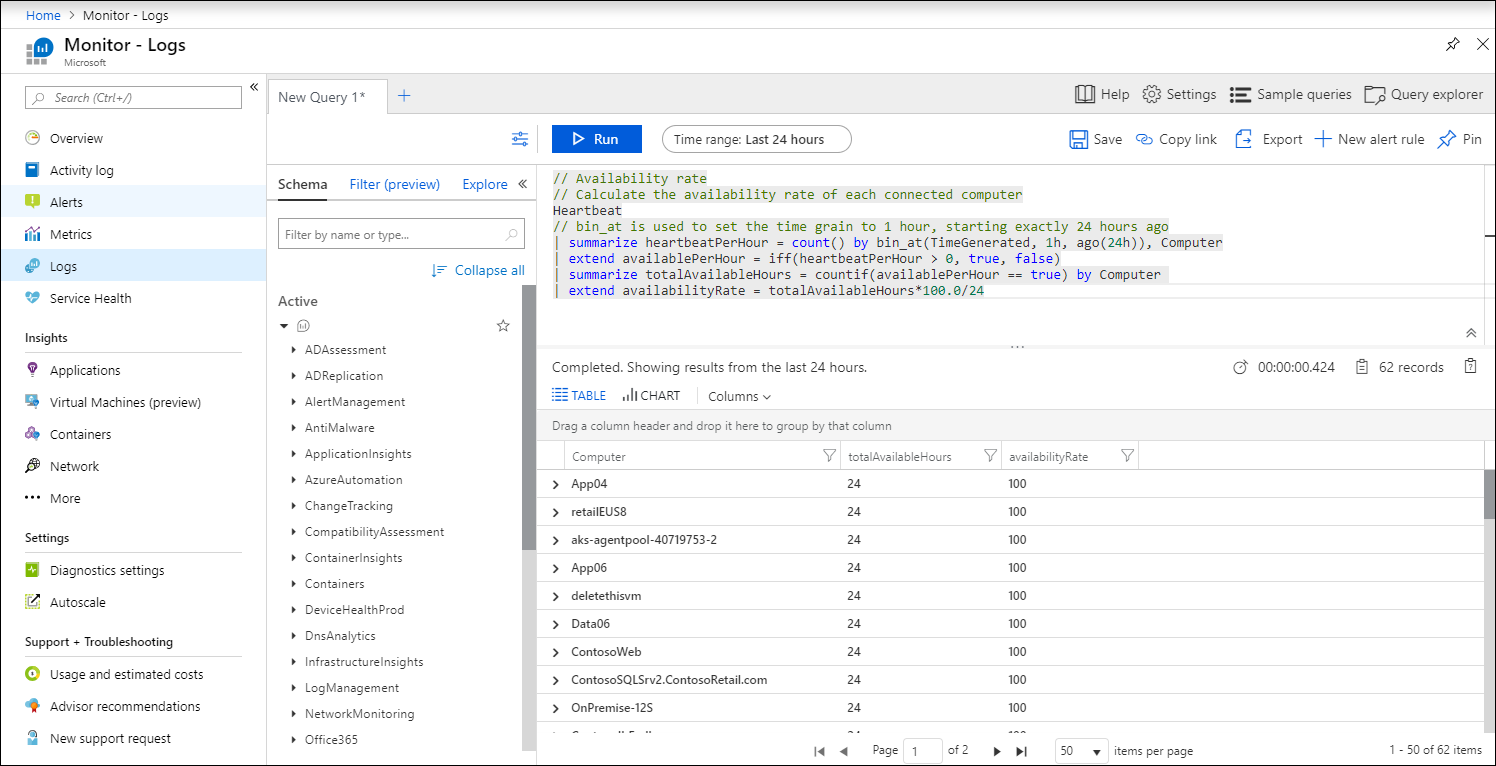
Along with using existing Azure Monitor features, you can analyze Logs data by using a sophisticated query language that's capable of quickly analyzing millions of records. You might perform a simple query that retrieves a specific set of records or perform sophisticated data analysis to identify critical patterns in your monitoring data. Work with log queries and their results interactively by using Log Analytics, use them in alert rules to be proactively notified of issues, or visualize their results in a workbook or dashboard.
Note
Azure Monitor Logs is one half of the data platform that supports Azure Monitor. The other is Azure Monitor Metrics, which stores numeric data in a time-series database. Numeric data is more lightweight than data in Azure Monitor Logs. Azure Monitor Metrics can support near real time scenarios, so it's useful for alerting and fast detection of issues.
Azure Monitor Metrics can only store numeric data in a particular structure, whereas Azure Monitor Logs can store a variety of data types that have their own structures. You can also perform complex analysis on Azure Monitor Logs data by using log queries, which can't be used for analysis of Azure Monitor Metrics data.
What can you do with Azure Monitor Logs?
The following table describes some of the ways that you can use Azure Monitor Logs.
| Capability | Description |
|---|---|
| Analyze | Use Log Analytics in the Azure portal to write log queries and interactively analyze log data by using a powerful analysis engine. |
| Alert | Configure a log search alert rule that sends a notification or takes automated action when the results of the query match a particular result. |
| Visualize | Pin query results rendered as tables or charts to an Azure dashboard. Create a workbook to combine with multiple sets of data in an interactive report. Export the results of a query to Power BI to use different visualizations and share with users outside Azure. Export the results of a query to Grafana to use its dashboarding and combine with other data sources. |
| Get insights | Logs support insights that provide a customized monitoring experience for particular applications and services. |
| Retrieve | Access log query results from:
|
| Import | Upload logs from a custom app via the REST API or client library for .NET, Go, Java, JavaScript, or Python. |
| Export | Configure automated export of log data to an Azure Storage account or Azure Event Hubs. Build a workflow to retrieve log data and copy it to an external location by using Azure Logic Apps. |
| Bring your own analysis | Analyze data in Azure Monitor Logs using a notebook to create streamlined, multi-step processes on top of data you collect in Azure Monitor Logs. This is especially useful for purposes such as building and running machine learning pipelines, advanced analysis, and troubleshooting guides (TSGs) for Support needs. |
Data collection
After you create a Log Analytics workspace, you must configure sources to send their data. No data is collected automatically.
This configuration will be different depending on the data source. For example:
- Create diagnostic settings to send resource logs from Azure resources to the workspace.
- Enable VM insights to collect data from virtual machines.
- Configure data sources on the workspace to collect more events and performance data.
Important
Most data collection in Logs will incur ingestion and retention costs. See Azure Monitor pricing before you enable any data collection.
Log Analytics workspaces
Azure Monitor Logs stores the data that it collects in one or more Log Analytics workspaces. You must create at least one workspace to use Azure Monitor Logs. For a description of Log Analytics workspaces, see Log Analytics workspace overview.
Log Analytics
Log Analytics is a tool in the Azure portal. Use it to edit and run log queries and interactively analyze their results. You can then use those queries to support other features in Azure Monitor, such as log search alerts and workbooks. Access Log Analytics from the Logs option on the Azure Monitor menu or from most other services in the Azure portal.
For a description of Log Analytics, see Overview of Log Analytics in Azure Monitor. To walk through using Log Analytics features to create a simple log query and analyze its results, see Log Analytics tutorial.
Log queries
Data is retrieved from a Log Analytics workspace through a log query, which is a read-only request to process data and return results. Log queries are written in Kusto Query Language (KQL). KQL is the same query language that Azure Data Explorer uses.
You can:
- Write log queries in Log Analytics to interactively analyze their results.
- Use them in alert rules to be proactively notified of issues.
- Include their results in workbooks or dashboards.
Insights include prebuilt queries to support their views and workbooks.
For a list of where log queries are used and references to tutorials and other documentation to get you started, see Log queries in Azure Monitor.
Relationship to Azure Data Explorer
Azure Monitor Logs is based on Azure Data Explorer. A Log Analytics workspace is roughly the equivalent of a database in Azure Data Explorer. Tables are structured the same, and both use KQL. For information on KQL, see Kusto Query Language (KQL) overview.
The experience of using Log Analytics to work with Azure Monitor queries in the Azure portal is similar to the experience of using the Azure Data Explorer Web UI. You can even include data from a Log Analytics workspace in an Azure Data Explorer query.
Relationship to Azure Sentinel and Microsoft Defender for Cloud
Security monitoring in Azure is performed by Microsoft Sentinel and Microsoft Defender for Cloud.
These services store their data in Azure Monitor Logs so that it can be analyzed with other log data collected by Azure Monitor.
Learn more
Next steps
- Learn about log queries to retrieve and analyze data from a Log Analytics workspace.
- Learn about metrics in Azure Monitor.
- Learn about the monitoring data available for various resources in Azure.
Feedback
Coming soon: Throughout 2024 we will be phasing out GitHub Issues as the feedback mechanism for content and replacing it with a new feedback system. For more information see: https://aka.ms/ContentUserFeedback.
Submit and view feedback for

