Debug high CPU usage in .NET Core
This article applies to: ✔️ .NET Core 3.1 SDK and later versions
In this tutorial, you'll learn how to debug an excessive CPU usage scenario. Using the provided example ASP.NET Core web app source code repository, you can cause a deadlock intentionally. The endpoint will stop responding and experience thread accumulation. You'll learn how you can use various tools to diagnose this scenario with several key pieces of diagnostics data.
In this tutorial, you will:
- Investigate high CPU usage
- Determine CPU usage with dotnet-counters
- Use dotnet-trace for trace generation
- Profile performance in PerfView
- Diagnose and solve excessive CPU usage
Prerequisites
The tutorial uses:
- .NET Core 3.1 SDK or a later version.
- Sample debug target to trigger the scenario.
- dotnet-trace to list processes and generate a profile.
- dotnet-counters to monitor cpu usage.
CPU counters
Before attempting to collect diagnostics data, you need to observe a high CPU condition. Run the sample application using the following command from the project root directory.
dotnet run
To find the process ID, use the following command:
dotnet-trace ps
Take note of the process ID from your command output. Our process ID was 22884, but yours will be different. To check the current CPU usage, use the dotnet-counters tool command:
dotnet-counters monitor --refresh-interval 1 -p 22884
The refresh-interval is the number of seconds between the counter polling CPU values. The output should be similar to the following:
Press p to pause, r to resume, q to quit.
    Status: Running

[System.Runtime]
    % Time in GC since last GC (%)                         0
    Allocation Rate / 1 sec (B)                            0
    CPU Usage (%)                                          0
    Exception Count / 1 sec                                0
    GC Heap Size (MB)                                      4
    Gen 0 GC Count / 60 sec                                0
    Gen 0 Size (B)                                         0
    Gen 1 GC Count / 60 sec                                0
    Gen 1 Size (B)                                         0
    Gen 2 GC Count / 60 sec                                0
    Gen 2 Size (B)                                         0
    LOH Size (B)                                           0
    Monitor Lock Contention Count / 1 sec                  0
    Number of Active Timers                                1
    Number of Assemblies Loaded                          140
    ThreadPool Completed Work Item Count / 1 sec           3
    ThreadPool Queue Length                                0
    ThreadPool Thread Count                                7
    Working Set (MB)                                      63
With the web app running, immediately after startup, the CPU isn't being consumed at all and is reported at 0%. Navigate to the api/diagscenario/highcpu route with 60000 as the route parameter:
https://localhost:5001/api/diagscenario/highcpu/60000
Now, rerun the dotnet-counters command. If interested in monitoring just the cpu-usage counter, add '--counters System.Runtime[cpu-usage]` to the previous command. We are unsure if the CPU is being consumed, so we will monitor the same list of counters as above to verify counter values are within expected range for our application.
dotnet-counters monitor -p 22884 --refresh-interval 1
You should see an increase in CPU usage as shown below (depending on the host machine, expect varying CPU usage):
Press p to pause, r to resume, q to quit.
    Status: Running

[System.Runtime]
    % Time in GC since last GC (%)                         0
    Allocation Rate / 1 sec (B)                            0
    CPU Usage (%)                                         25
    Exception Count / 1 sec                                0
    GC Heap Size (MB)                                      4
    Gen 0 GC Count / 60 sec                                0
    Gen 0 Size (B)                                         0
    Gen 1 GC Count / 60 sec                                0
    Gen 1 Size (B)                                         0
    Gen 2 GC Count / 60 sec                                0
    Gen 2 Size (B)                                         0
    LOH Size (B)                                           0
    Monitor Lock Contention Count / 1 sec                  0
    Number of Active Timers                                1
    Number of Assemblies Loaded                          140
    ThreadPool Completed Work Item Count / 1 sec           3
    ThreadPool Queue Length                                0
    ThreadPool Thread Count                                7
    Working Set (MB)                                      63
Throughout the duration of the request, the CPU usage will hover around the increased percentage.
Tip
To visualize an even higher CPU usage, you can exercise this endpoint in multiple browser tabs simultaneously.
At this point, you can safely say the CPU is running higher than you expect. Identifying the effects of a problem is key to finding the cause. We will use the effect of high CPU consumption in addition to diagnostic tools to find the cause of the problem.
Analyze High CPU with Profiler
When analyzing an app with high CPU usage, you need a diagnostics tool that can provide insights into what the code is doing. The usual choice is a profiler, and there are different profiler options to choose from. dotnet-trace can be used on all operating systems, however, its limitations of safe-point bias and managed-only callstacks result in more general information compared to a kernel-aware profiler like 'perf' for Linux or ETW for Windows. If your performance investigation involves only managed code, generally dotnet-trace will be sufficient.
The perf tool can be used to generate .NET Core app profiles. We will demonstrate this tool, although dotnet-trace could be used as well. Exit the previous instance of the sample debug target.
Set the DOTNET_PerfMapEnabled environment variable to cause the .NET app to create a map file in the /tmp directory. This map file is used by perf to map CPU addresses to JIT-generated functions by name. For more information, see Export perf maps and jit dumps.
Note
.NET 6 standardizes on the prefix DOTNET_ instead of COMPlus_ for environment variables that configure .NET run-time behavior. However, the COMPlus_ prefix will continue to work. If you're using a previous version of the .NET runtime, you should still use the COMPlus_ prefix for environment variables.
Run the sample debug target in the same terminal session.
export DOTNET_PerfMapEnabled=1
dotnet run
Exercise the high CPU API endpoint (https://localhost:5001/api/diagscenario/highcpu/60000) again. While it's running within the 1-minute request, run the perf command with your process ID:
sudo perf record -p 2266 -g
The perf command starts the performance collection process. Let it run for about 20-30 seconds, then press Ctrl+C to exit the collection process. You can use the same perf command to see the output of the trace.
sudo perf report -f
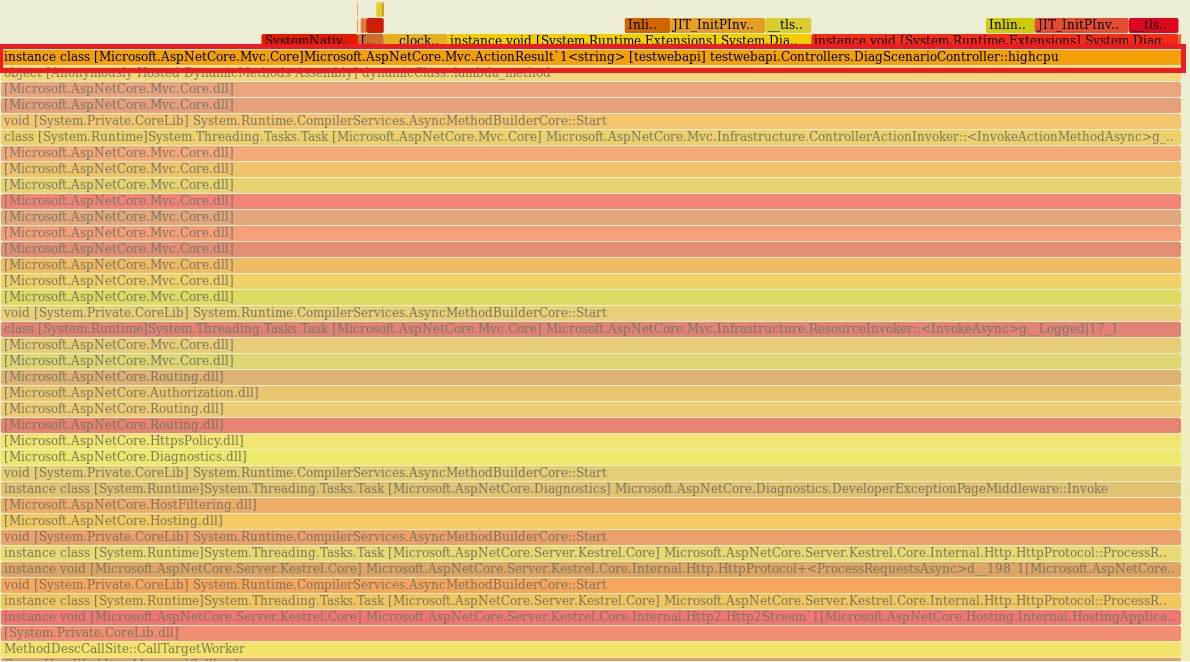
You can also generate a flame-graph by using the following commands:
git clone --depth=1 https://github.com/BrendanGregg/FlameGraph
sudo perf script | FlameGraph/stackcollapse-perf.pl | FlameGraph/flamegraph.pl > flamegraph.svg
This command generates a flamegraph.svg that you can view in the browser to investigate the performance problem:
Analyzing High CPU Data with Visual Studio
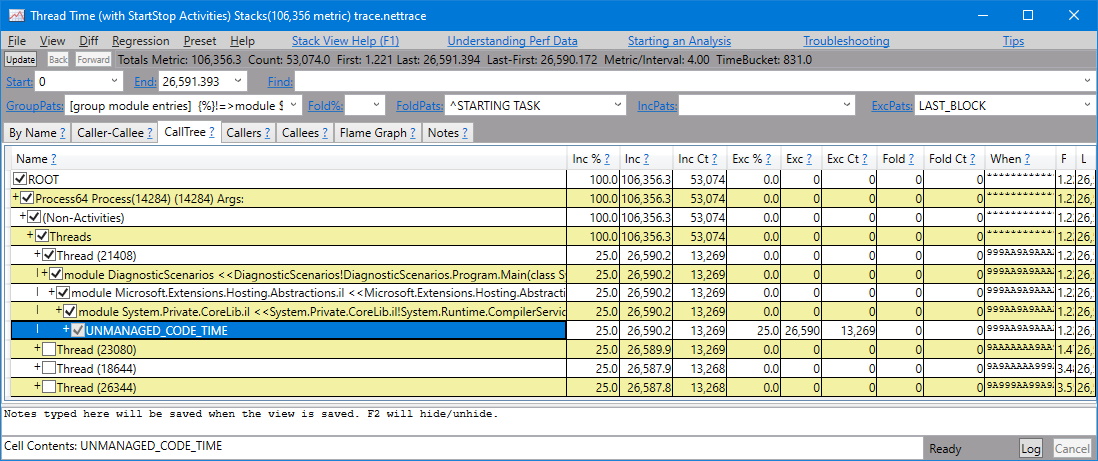
All *.nettrace files can be analyzed in Visual Studio. To analyze a Linux *.nettrace file in Visual Studio, transfer the *.nettrace file, in addition to the other necessary documents, to a Windows machine, and then open the *.nettrace file in Visual Studio. For more information, see Analyze CPU Usage Data.
See also
- dotnet-trace to list processes
- dotnet-counters to check managed memory usage
- dotnet-dump to collect and analyze a dump file
- dotnet/diagnostics
Next steps
Feedback
Coming soon: Throughout 2024 we will be phasing out GitHub Issues as the feedback mechanism for content and replacing it with a new feedback system. For more information see: https://aka.ms/ContentUserFeedback.
Submit and view feedback for


