ExpressRoute monitoring, metrics, and alerts
This article helps you understand ExpressRoute monitoring, metrics, and alerts using Azure Monitor. Azure Monitor is one stop shop for all metrics, alerting, diagnostic logs across all of Azure.
Note
Using Classic Metrics is not recommended.
ExpressRoute metrics
To view Metrics, go to the Azure Monitor page and select Metrics. To view ExpressRoute metrics, filter by Resource Type ExpressRoute circuits. To view Global Reach metrics, filter by Resource Type ExpressRoute circuits and select an ExpressRoute circuit resource that has Global Reach enabled. To view ExpressRoute Direct metrics, filter Resource Type by ExpressRoute Ports.
Once a metric is selected, the default aggregation is applied. Optionally, you can apply splitting, which shows the metric with different dimensions.
Important
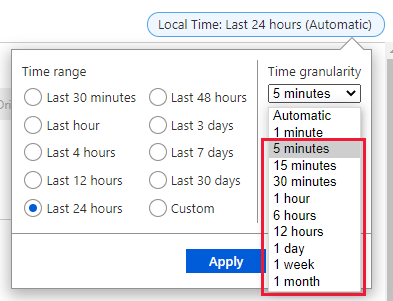
When viewing ExpressRoute metrics in the Azure portal, select a time granularity of 5 minutes or greater for best possible results.
Aggregation Types:
Metrics explorer supports sum, maximum, minimum, average and count as aggregation types. You should use the recommended Aggregation type when reviewing the insights for each ExpressRoute metric.
- Sum: The sum of all values captured during the aggregation interval.
- Count: The number of measurements captured during the aggregation interval.
- Average: The average of the metric values captured during the aggregation interval.
- Min: The smallest value captured during the aggregation interval.
- Max: The largest value captured during the aggregation interval.
ExpressRoute circuit
| Metric | Category | Unit | Aggregation Type | Description | Dimensions | Exportable via Diagnostic Settings? |
|---|---|---|---|---|---|---|
| ARP Availability | Availability | Percent | Average | ARP Availability from MSEE towards all peers. | Peering Type, Peer | Yes |
| BGP Availability | Availability | Percent | Average | BGP Availability from MSEE towards all peers. | Peering Type, Peer | Yes |
| BitsInPerSecond | Traffic | BitsPerSecond | Average | Bits ingressing Azure per second | Peering Type | Yes |
| BitsOutPerSecond | Traffic | BitsPerSecond | Average | Bits egressing Azure per second | Peering Type | Yes |
| DroppedInBitsPerSecond | Traffic | BitsPerSecond | Average | Ingress bits of data dropped per second | Peering Type | Yes |
| DroppedOutBitsPerSecond | Traffic | BitPerSecond | Average | Egress bits of data dropped per second | Peering Type | Yes |
| GlobalReachBitsInPerSecond | Traffic | BitsPerSecond | Average | Bits ingressing Azure per second | PeeredCircuitSKey | Yes |
| GlobalReachBitsOutPerSecond | Traffic | BitsPerSecond | Average | Bits egressing Azure per second | PeeredCircuitSKey | Yes |
| FastPathRoutesCount | Fastpath | Count | Maximum | Count of FastPath routes configured on the circuit | None | Yes |
Note
Using GlobalGlobalReachBitsInPerSecond and GlobalGlobalReachBitsOutPerSecond will only be visible if at least one Global Reach connection is established.
ExpressRoute gateways
| Metric | Category | Unit | Aggregation Type | Description | Dimensions | Exportable via Diagnostic Settings? |
|---|---|---|---|---|---|---|
| Bits received per second | Performance | BitsPerSecond | Average | Total bits received on ExpressRoute gateway per second | roleInstance | Yes |
| CPU utilization | Performance | Count | Average | CPU Utilization of the ExpressRoute Gateway | roleInstance | Yes |
| Packets per second | Performance | CountPerSecond | Average | Total Packets received on ExpressRoute Gateway per second | roleInstance | Yes |
| Count of routes advertised to peer | Availability | Count | Maximum | Count Of Routes Advertised To Peer by ExpressRouteGateway | roleInstance | Yes |
| Count of routes learned from peer | Availability | Count | Maximum | Count Of Routes Learned From Peer by ExpressRouteGateway | roleInstance | Yes |
| Frequency of routes changed | Availability | Count | Total | Frequency of Routes change in ExpressRoute Gateway | roleInstance | Yes |
| Number of VMs in virtual network | Availability | Count | Maximum | Estimated number of VMs in the virtual network | No Dimensions | Yes |
| Active flows | Scalability | Count | Average | Number of active flows on ExpressRoute Gateway | roleInstance | Yes |
| Max flows created per second | Scalability | FlowsPerSecond | Maximum | Maximum number of flows created per second on ExpressRoute Gateway | roleInstance, direction | Yes |
ExpressRoute Gateway connections
| Metric | Category | Unit | Aggregation Type | Description | Dimensions | Exportable via Diagnostic Settings? |
|---|---|---|---|---|---|---|
| BitsInPerSecond | Traffic | BitsPerSecond | Average | Bits ingressing Azure per second through ExpressRoute gateway | ConnectionName | Yes |
| BitsOutPerSecond | Traffic | BitsPerSecond | Average | Bits egressing Azure per second through ExpressRoute gateway | ConnectionName | Yes |
ExpressRoute Direct
| Metric | Category | Unit | Aggregation Type | Description | Dimensions | Exportable via Diagnostic Settings? |
|---|---|---|---|---|---|---|
| BitsInPerSecond | Traffic | BitsPerSecond | Average | Bits ingressing Azure per second | Link | Yes |
| BitsOutPerSecond | Traffic | BitsPerSecond | Average | Bits egressing Azure per second | Link | Yes |
| DroppedInBitsPerSecond | Traffic | BitsPerSecond | Average | Ingress bits of data dropped per second | Link | Yes |
| DroppedOutBitsPerSecond | Traffic | BitPerSecond | Average | Egress bits of data dropped per second | Link | Yes |
| AdminState | Physical Connectivity | Count | Average | Admin state of the port | Link | Yes |
| LineProtocol | Physical Connectivity | Count | Average | Line protocol status of the port | Link | Yes |
| RxLightLevel | Physical Connectivity | Count | Average | Rx Light level in dBm | Link, Lane | Yes |
| TxLightLevel | Physical Connectivity | Count | Average | Tx light level in dBm | Link, Lane | Yes |
| FastPathRoutesCount | FastPath | Count | Maximum | Count of FastPath routes configured on the port | None | Yes |
ExpressRoute Traffic Collector
| Metric | Category | Unit | Aggregation Type | Description | Dimensions | Exportable via Diagnostic Settings? |
|---|---|---|---|---|---|---|
| CPU utilization | Performance | Count | Average | CPU Utilization of the ExpressRoute Traffic Collector | roleInstance | Yes |
| Memory Utilization | Performance | CountPerSecond | Average | Memory Utilization of the ExpressRoute Traffic Collector | roleInstance | Yes |
| Count of flow records processed | Availability | Count | Maximum | Count of number of flow records processed or ingested | roleInstance, ExpressRoute Circuit | Yes |
Circuits metrics
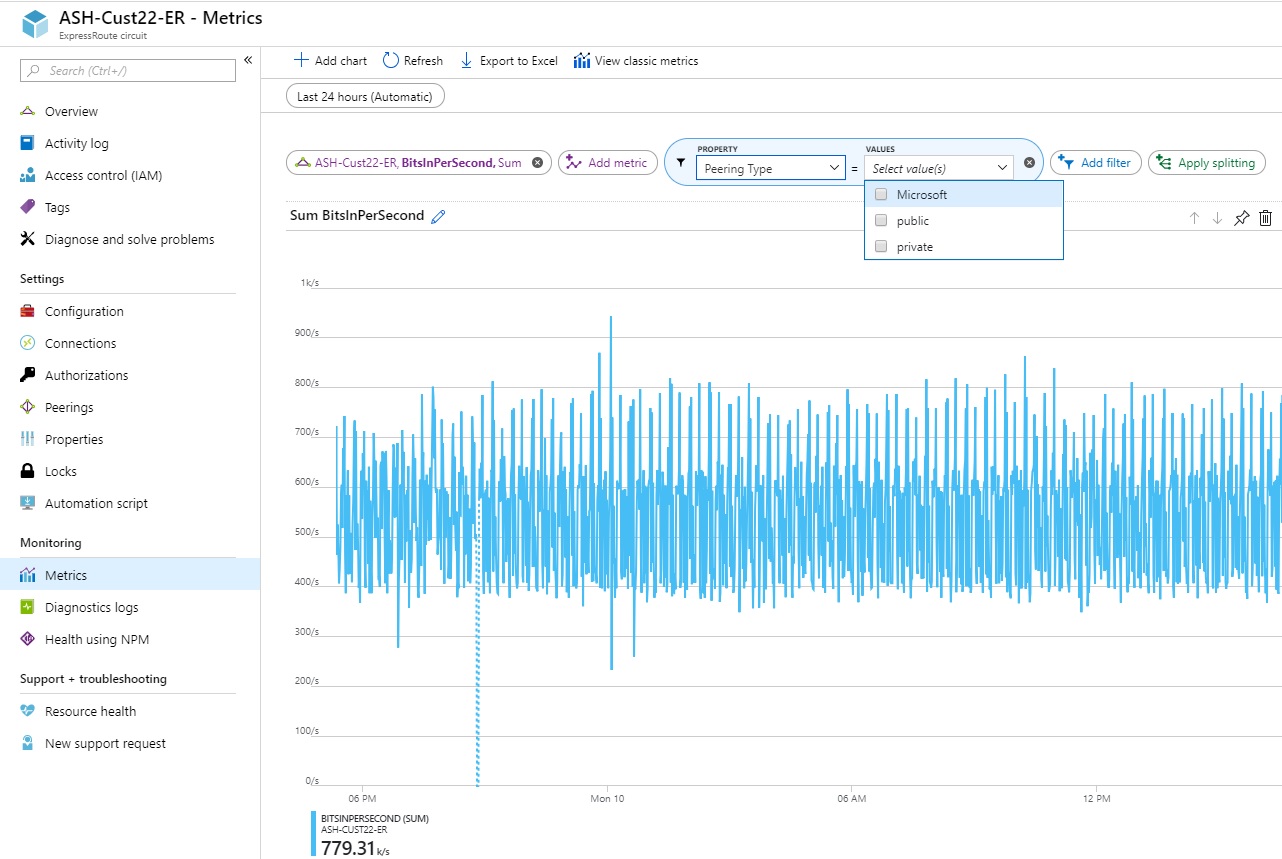
Bits In and Out - Metrics across all peerings
Aggregation type: Avg
You can view metrics across all peerings on a given ExpressRoute circuit.
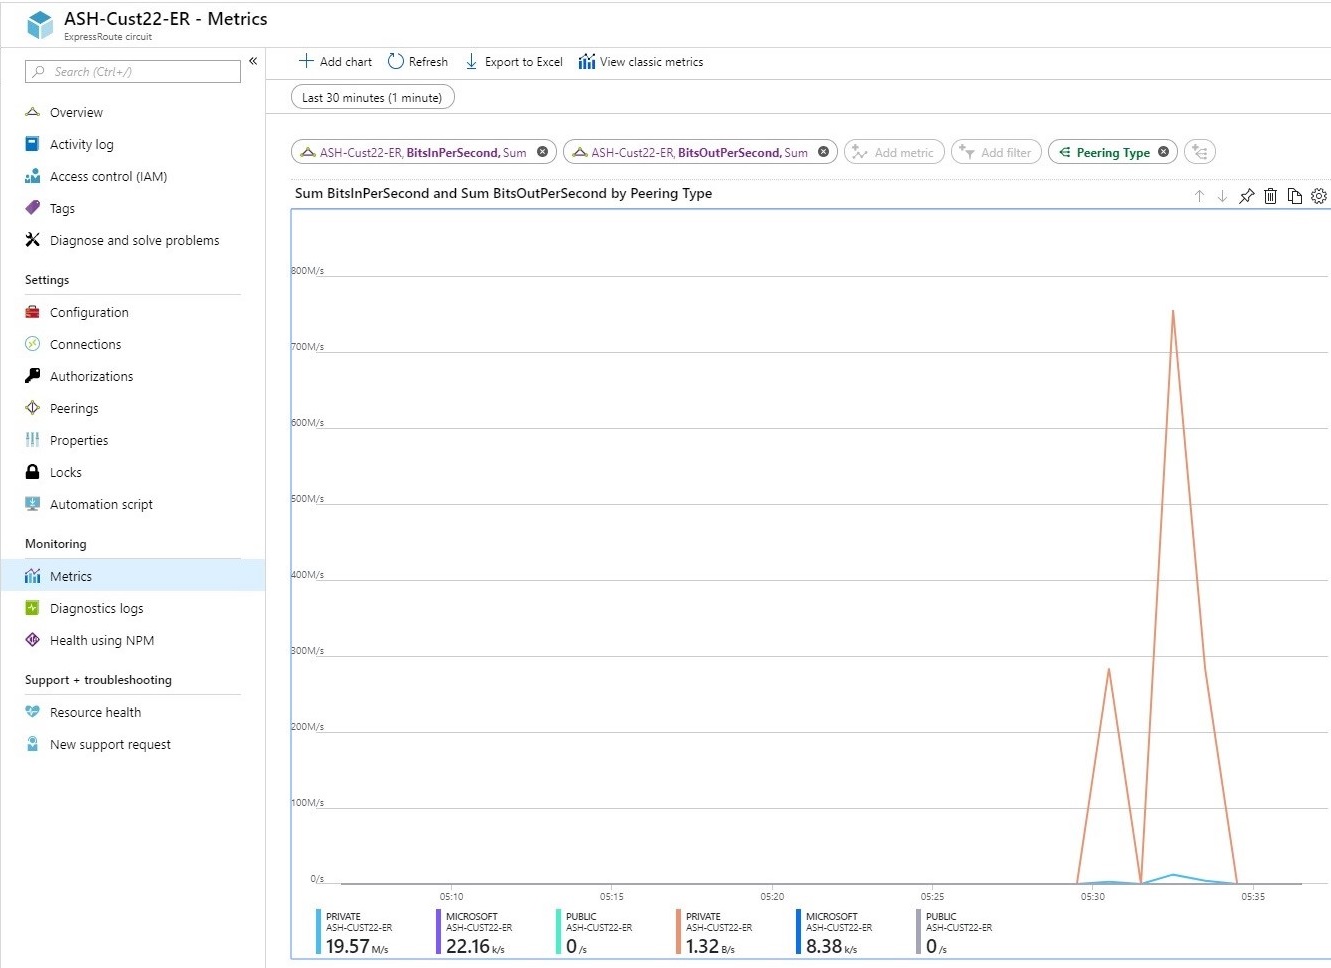
Bits In and Out - Metrics per peering
Aggregation type: Avg
You can view metrics for private, public, and Microsoft peering in bits/second.
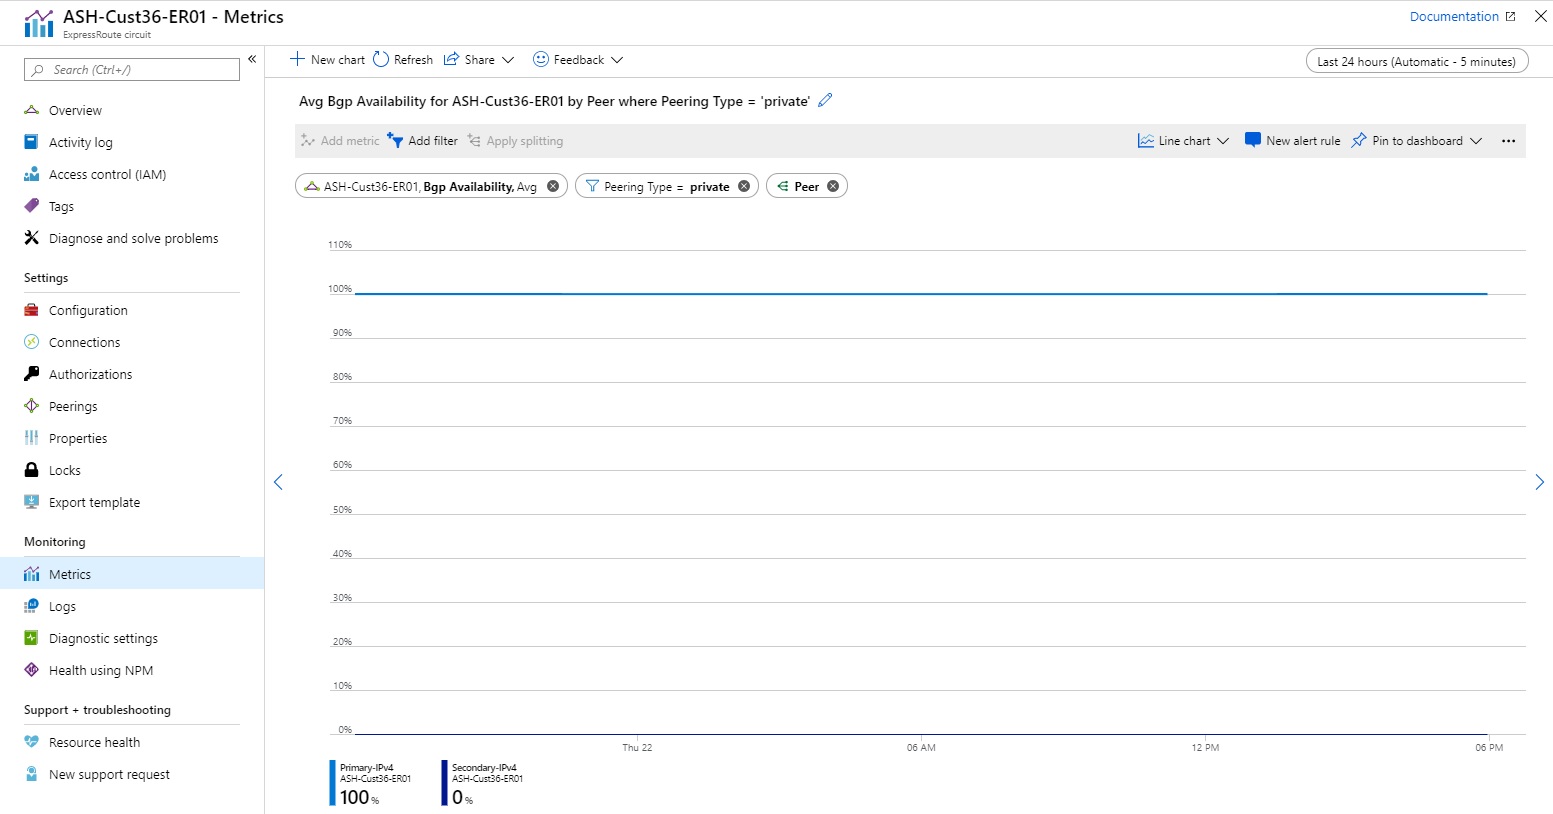
BGP Availability - Split by Peer
Aggregation type: Avg
You can view near to real-time availability of BGP (Layer-3 connectivity) across peerings and peers (Primary and Secondary ExpressRoute routers). This dashboard shows the Primary BGP session status is up for private peering and the Second BGP session status is down for private peering.
Note
During maintenance between the Microsoft edge and core network, BGP availability will appear down even if the BGP session between the customer edge and Microsoft edge remains up. For information about maintenance between the Microsoft edge and core network, make sure to have your maintenance alerts turned on and configured.
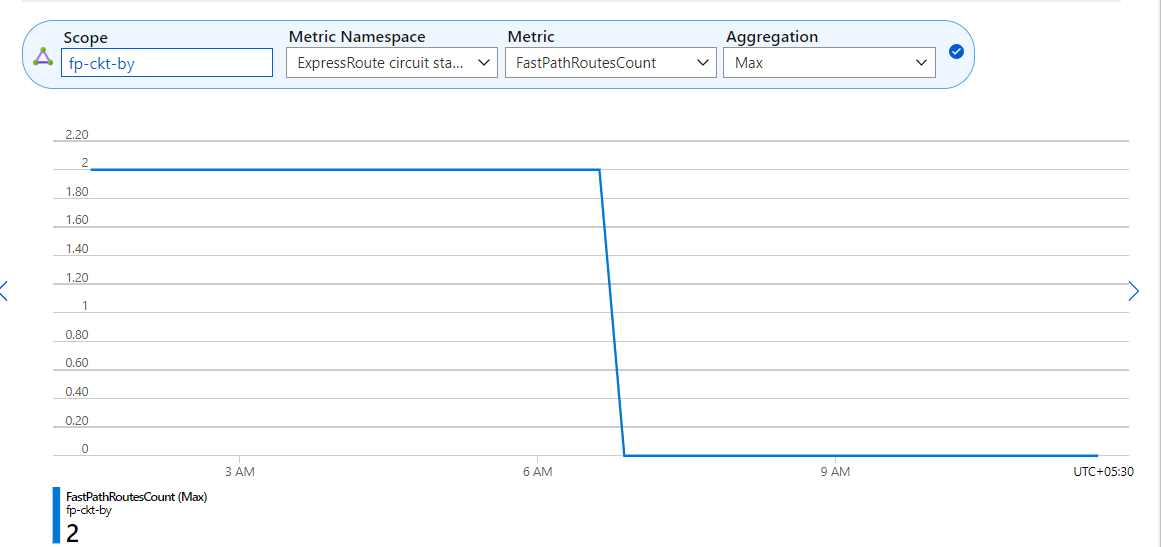
FastPath routes count (at circuit level)
Aggregation type: Max
This metric shows the number of FastPath routes configured on a circuit. Set an alert for when the number of FastPath routes on a circuit goes beyond the threshold limit. For more information, see ExpressRoute FastPath limits.
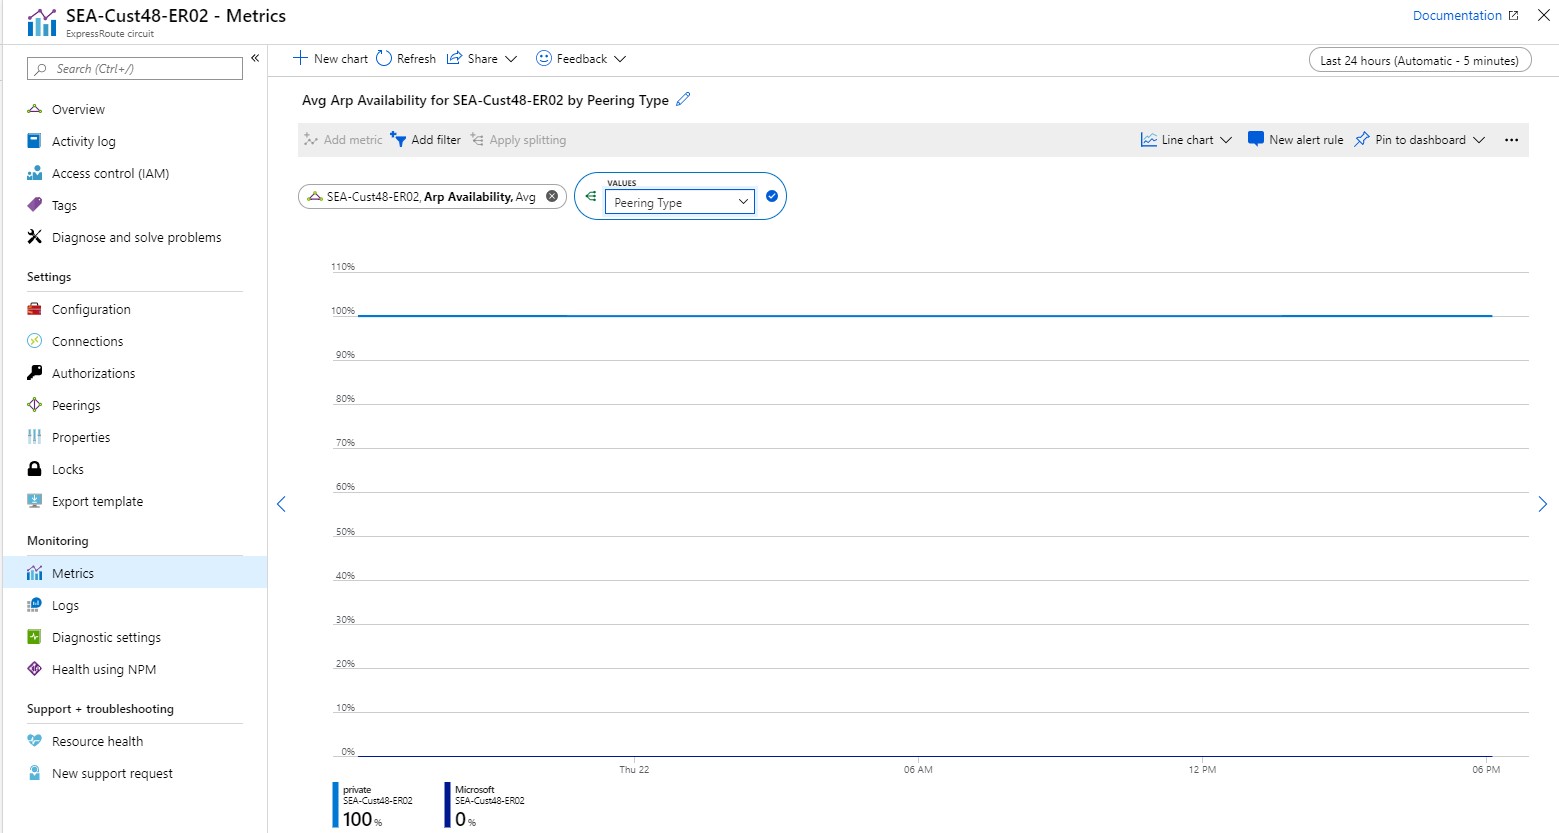
ARP Availability - Split by Peering
Aggregation type: Avg
You can view near to real-time availability of ARP (Layer-2 connectivity) across peerings and peers (Primary and Secondary ExpressRoute routers). This dashboard shows the Private Peering ARP session status is up across both peers, but down for Microsoft peering for both peers. The default aggregation (Average) was utilized across both peers.
ExpressRoute Direct Metrics
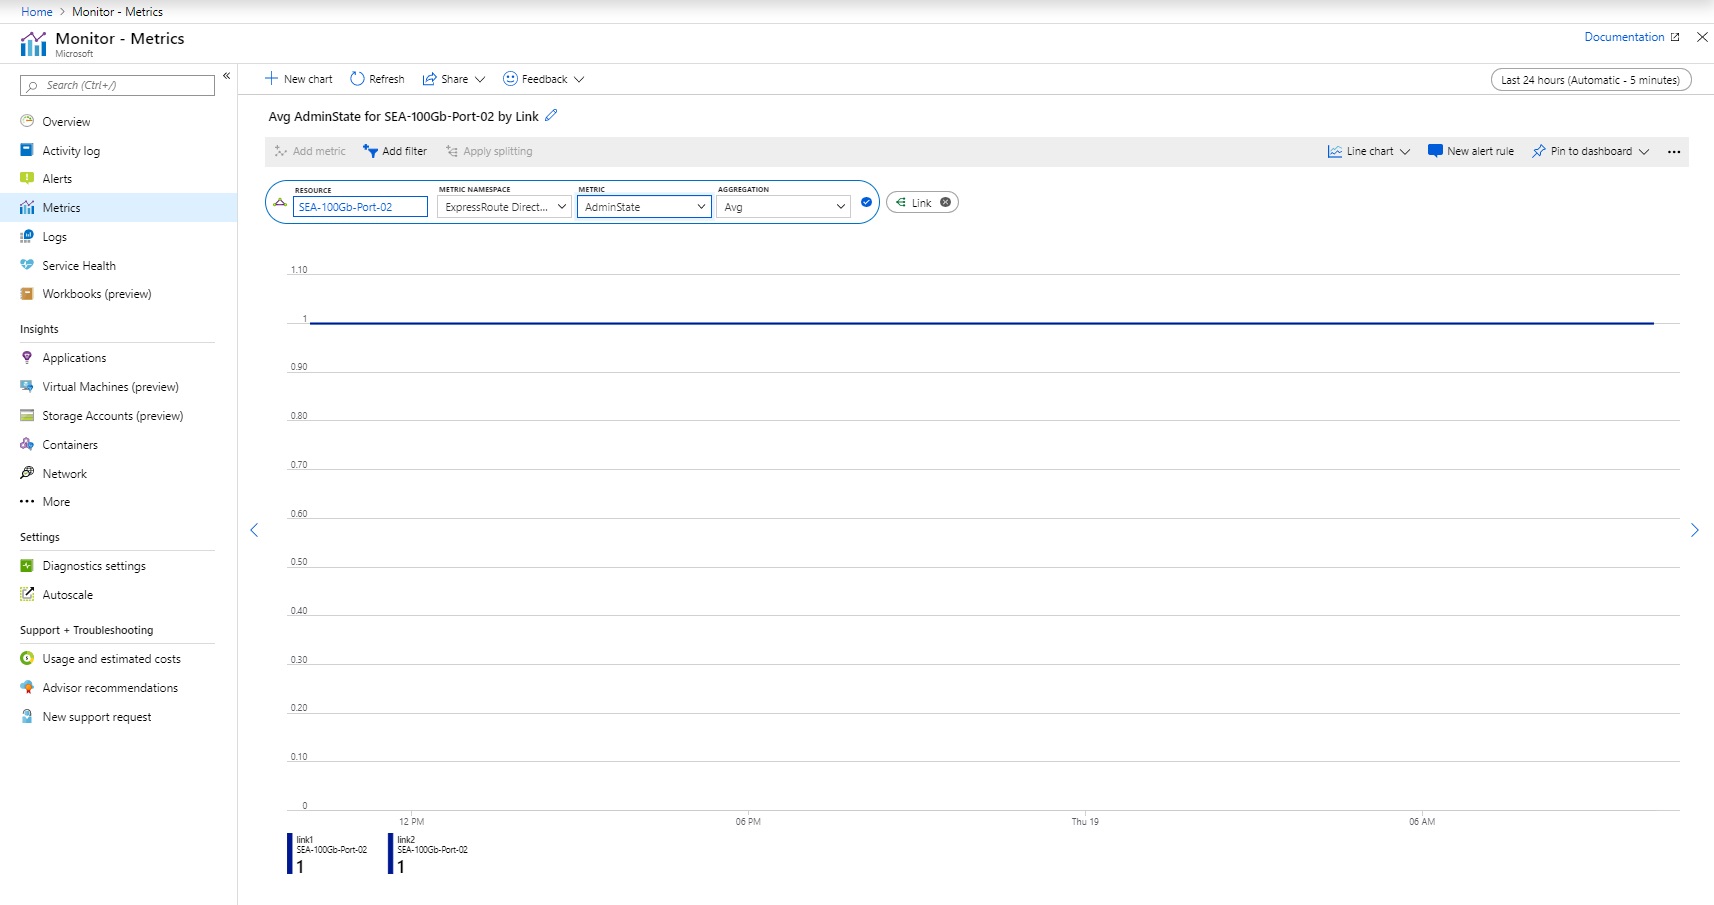
Admin State - Split by link
Aggregation type: Avg
You can view the Admin state for each link of the ExpressRoute Direct port pair. The Admin state represents if the physical port is on or off. This state is required to pass traffic across the ExpressRoute Direct connection.
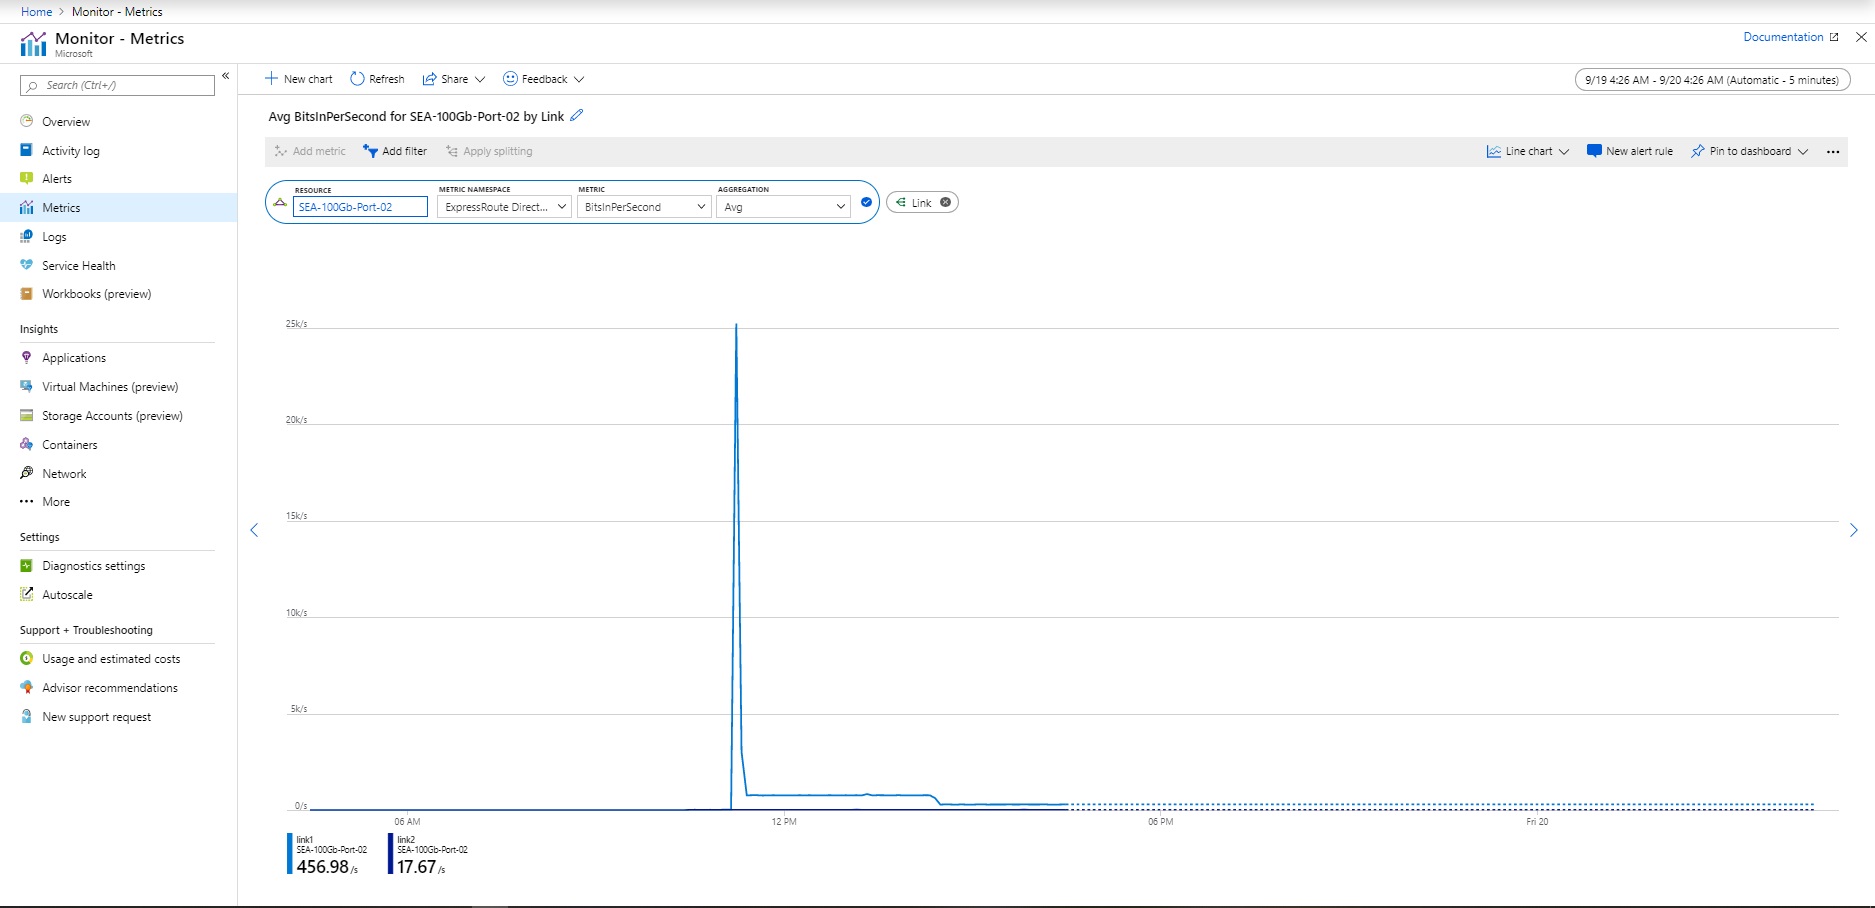
Bits In Per Second - Split by link
Aggregation type: Avg
You can view the bits in per second across both links of the ExpressRoute Direct port pair. Monitor this dashboard to compare inbound bandwidth for both links.
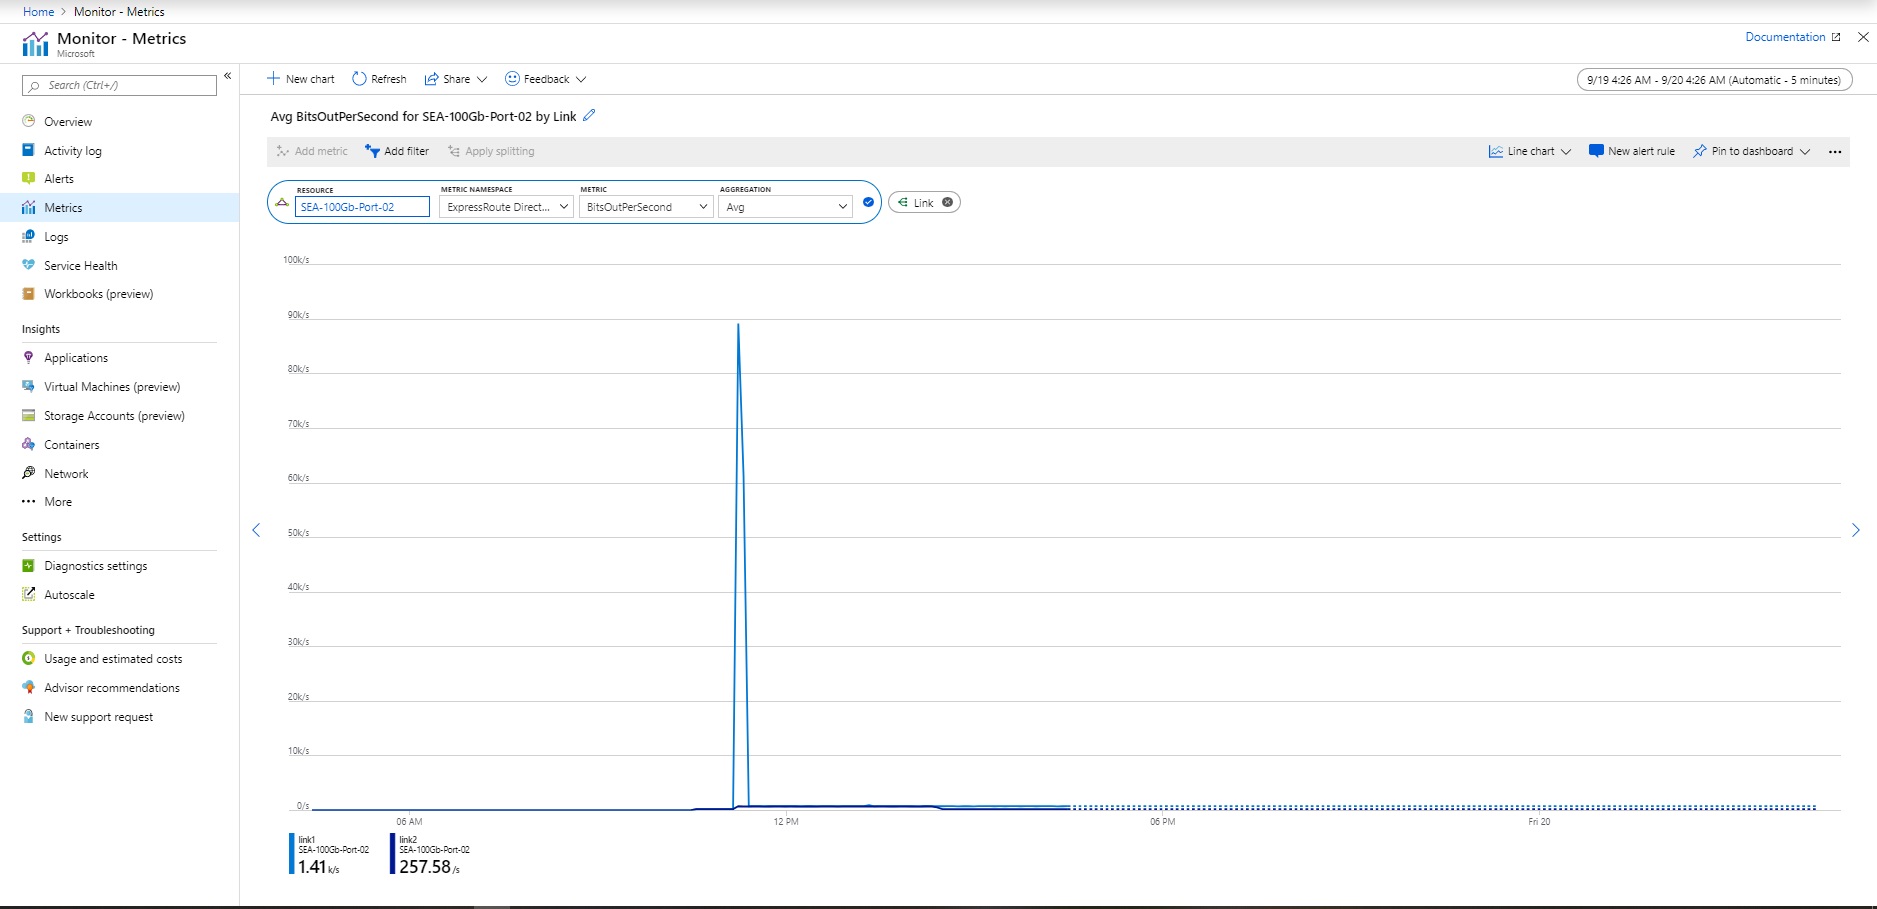
Bits Out Per Second - Split by link
Aggregation type: Avg
You can also view the bits out per second across both links of the ExpressRoute Direct port pair. Monitor this dashboard to compare outbound bandwidth for both links.
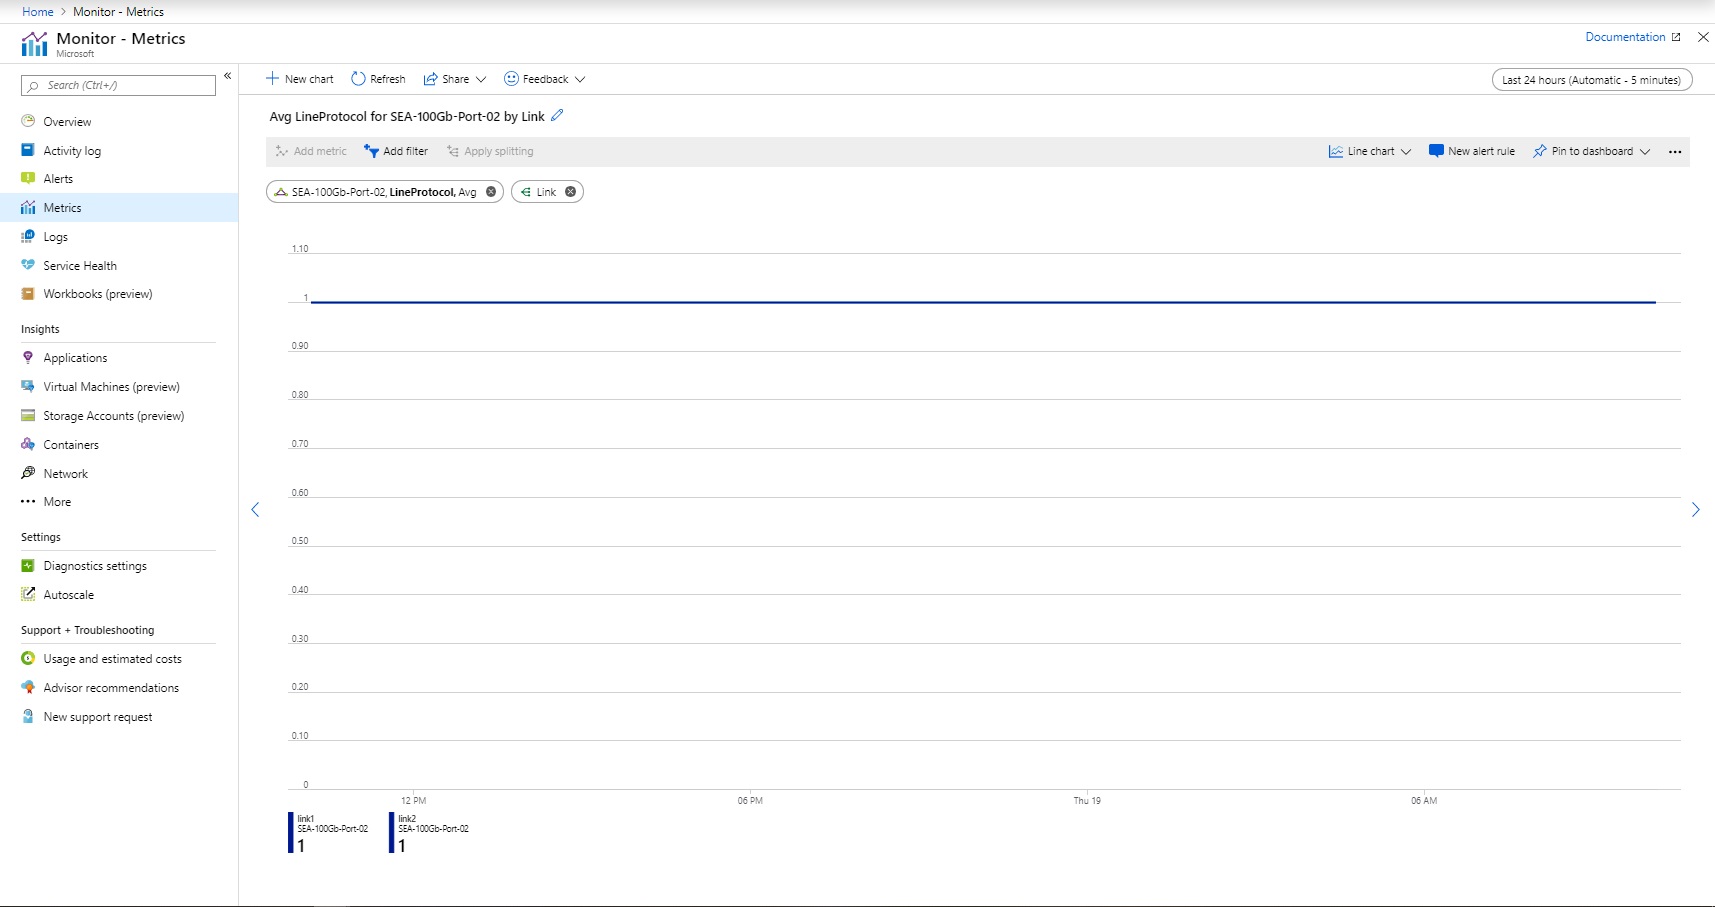
Line Protocol - Split by link
Aggregation type: Avg
You can view the line protocol across each link of the ExpressRoute Direct port pair. The Line Protocol indicates if the physical link is up and running over ExpressRoute Direct. Monitor this dashboard and set alerts to know when the physical connection goes down.
Rx Light Level - Split by link
Aggregation type: Avg
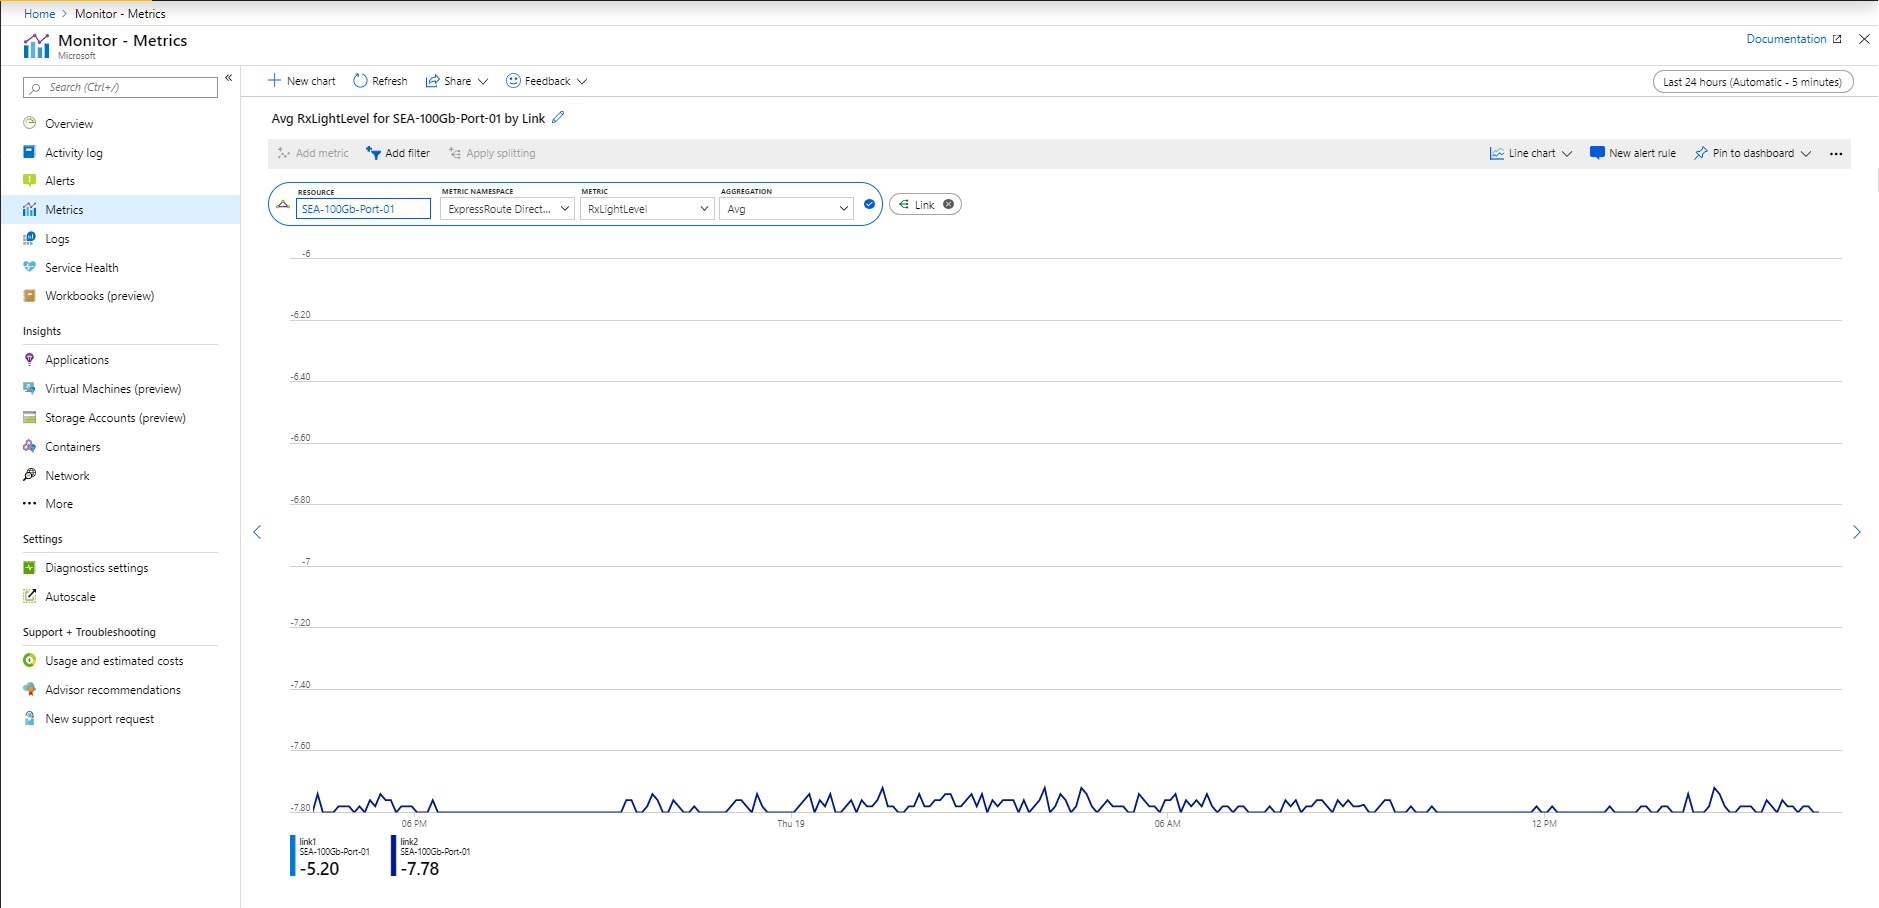
You can view the Rx light level (the light level that the ExpressRoute Direct port is receiving) for each port. Healthy Rx light levels generally fall within a range of -10 dBm to 0 dBm. Set alerts to be notified if the Rx light level falls outside of the healthy range.
Note
ExpressRoute Direct connectivity is hosted across different device platforms. Some ExpressRoute Direct connections will support a split view for Rx light levels by lane. However, this is not supported on all deployments.
Tx Light Level - Split by link
Aggregation type: Avg
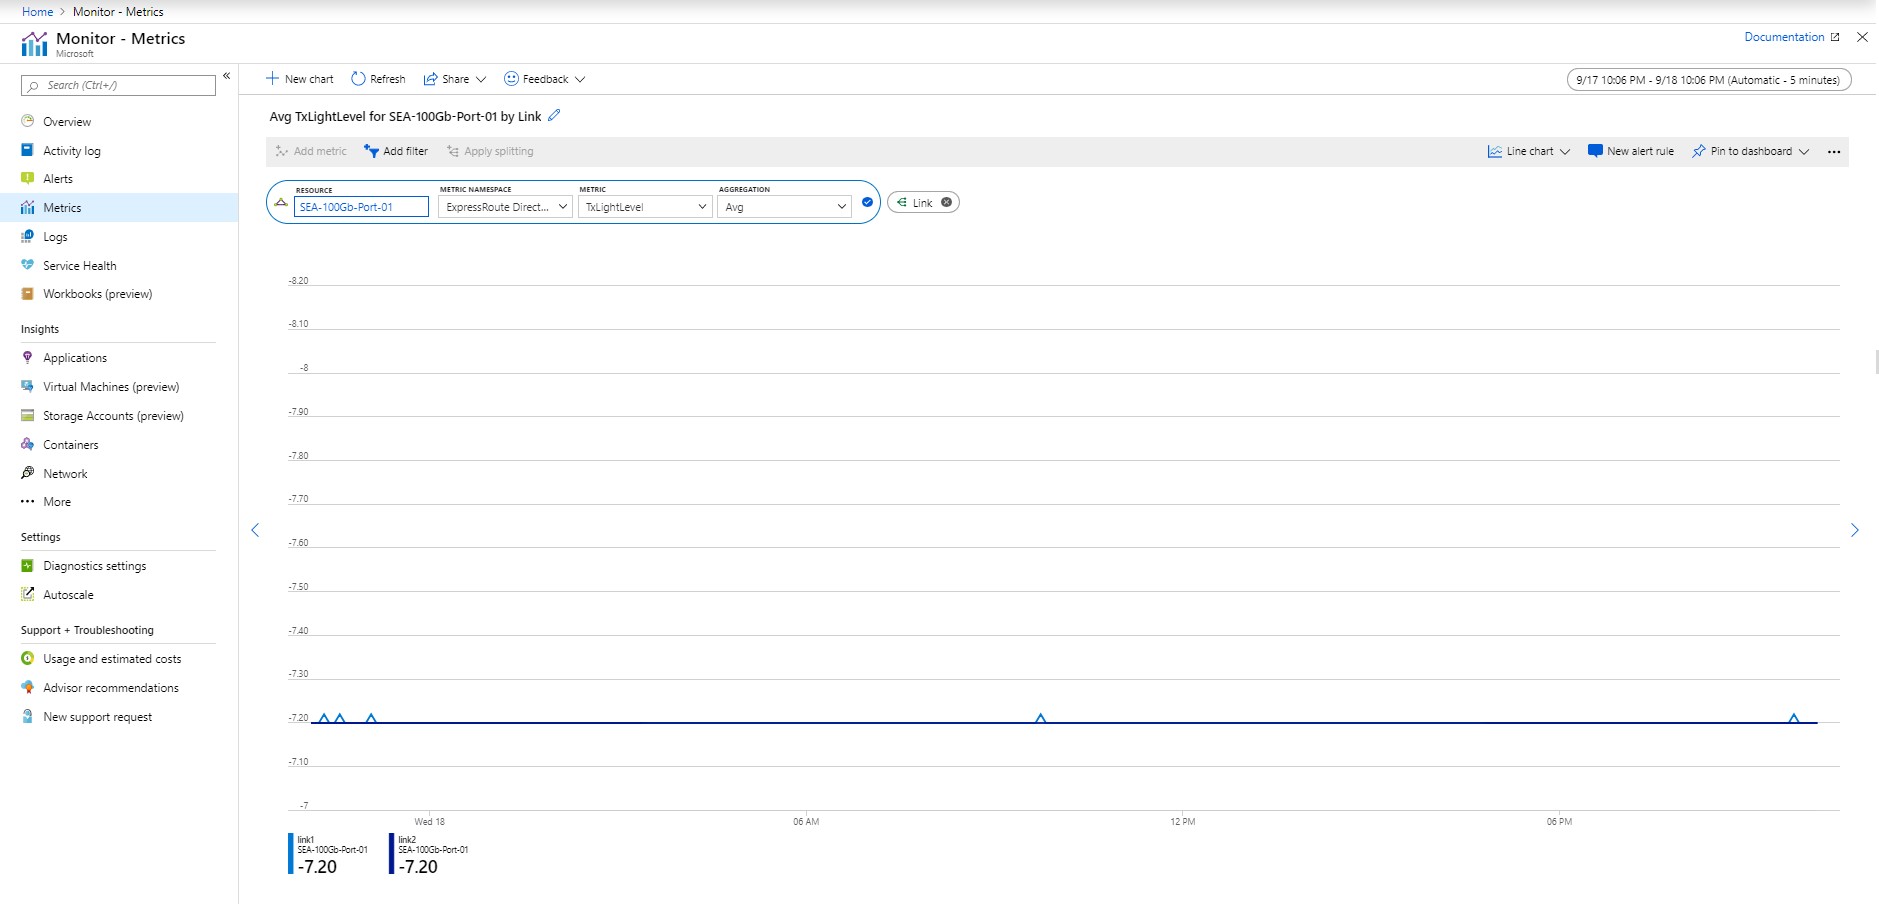
You can view the Tx light level (the light level that the ExpressRoute Direct port is transmitting) for each port. Healthy Tx light levels generally fall within a range of -10 dBm to 0 dBm. Set alerts to be notified if the Tx light level falls outside of the healthy range.
Note
ExpressRoute Direct connectivity is hosted across different device platforms. Some ExpressRoute Direct connections will support a split view for Tx light levels by lane. However, this is not supported on all deployments.
FastPath routes count (at port level)
Aggregation type: Max
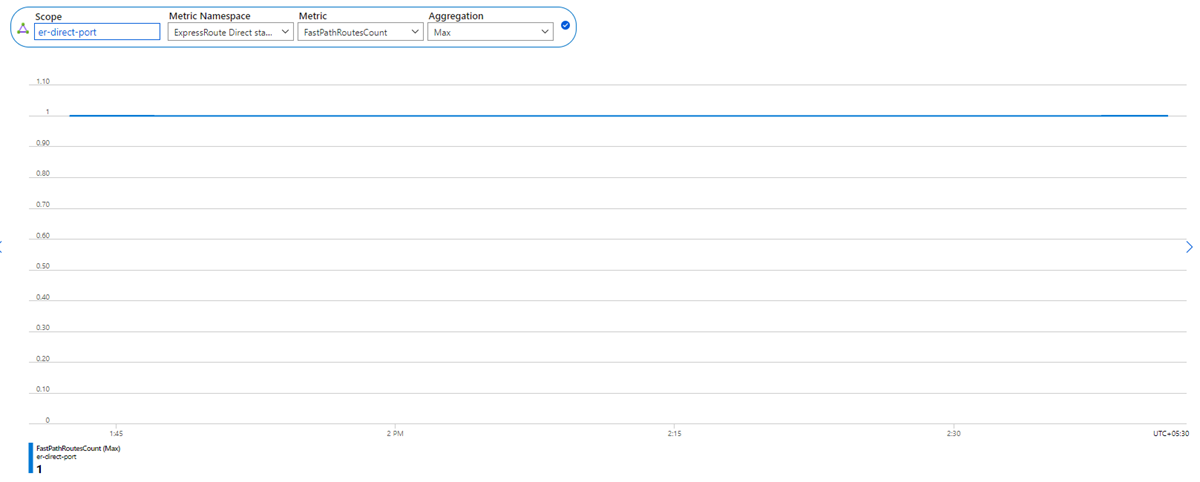
This metric shows the number of FastPath routes configured on an ExpressRoute Direct port.
Guidance: Set an alert for when the number of FastPath routes on the port goes beyond the threshold limit. For more information, see ExpressRoute FastPath limits.
ExpressRoute Virtual Network Gateway Metrics
Aggregation type: Avg
When you deploy an ExpressRoute gateway, Azure manages the compute and functions of your gateway. There are six gateway metrics available to you to better understand the performance of your gateway:
- Bits received per second
- CPU Utilization
- Packets per seconds
- Count of routes advertised to peers
- Count of routes learned from peers
- Frequency of routes changed
- Number of VMs in the virtual network
- Active flows
- Max flows created per second
We highly recommended you set alerts for each of these metrics so that you're aware of when your gateway could be seeing performance issues.
Bits received per second - Split by instance
Aggregation type: Avg
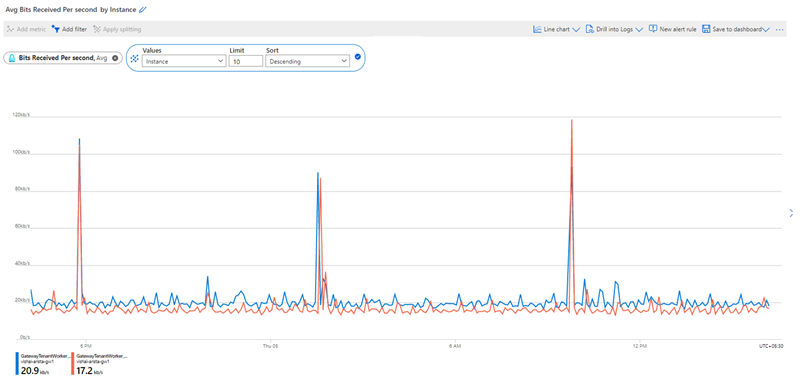
This metric captures inbound bandwidth utilization on the ExpressRoute virtual network gateway instances. Set an alert for how frequent the bandwidth utilization exceeds a certain threshold. If you need more bandwidth, increase the size of the ExpressRoute virtual network gateway.
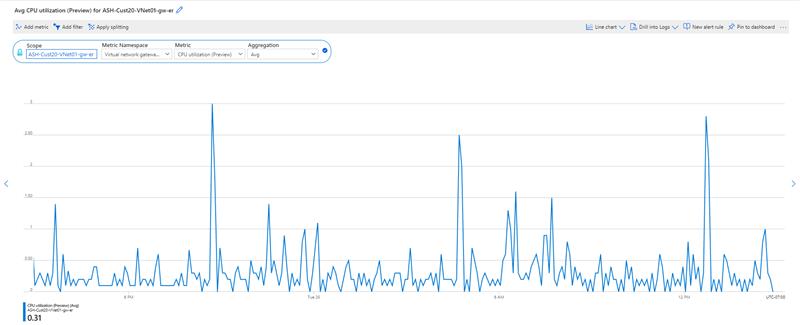
CPU Utilization - Split by instance
Aggregation type: Avg
You can view the CPU utilization of each gateway instance. The CPU utilization might spike briefly during routine host maintenance but prolong high CPU utilization could indicate your gateway is reaching a performance bottleneck. Increasing the size of the ExpressRoute gateway might resolve this issue. Set an alert for how frequent the CPU utilization exceeds a certain threshold.
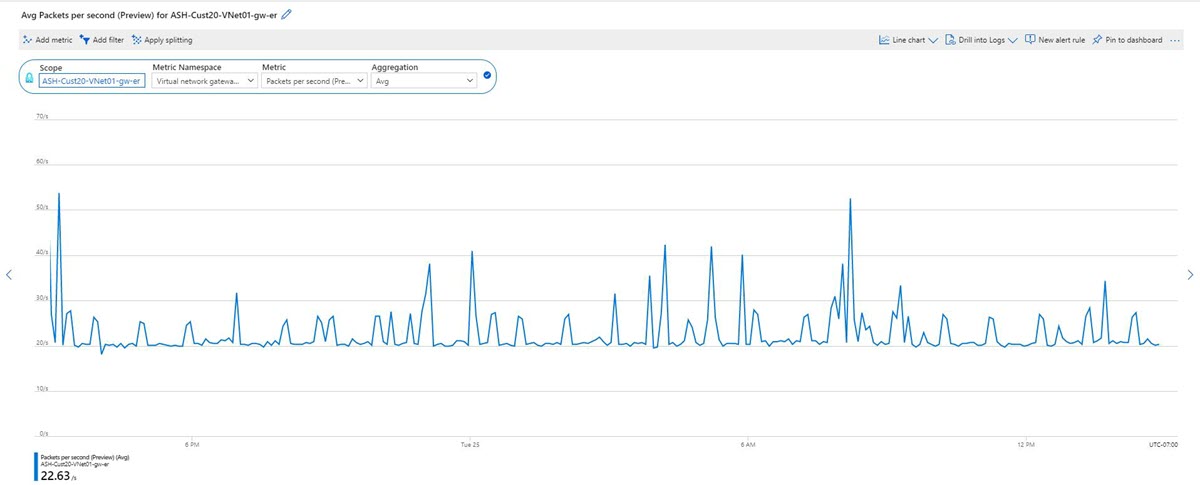
Packets Per Second - Split by instance
Aggregation type: Avg
This metric captures the number of inbound packets traversing the ExpressRoute gateway. You should expect to see a consistent stream of data here if your gateway is receiving traffic from your on-premises network. Set an alert for when the number of packets per second drops below a threshold indicating that your gateway is no longer receiving traffic.
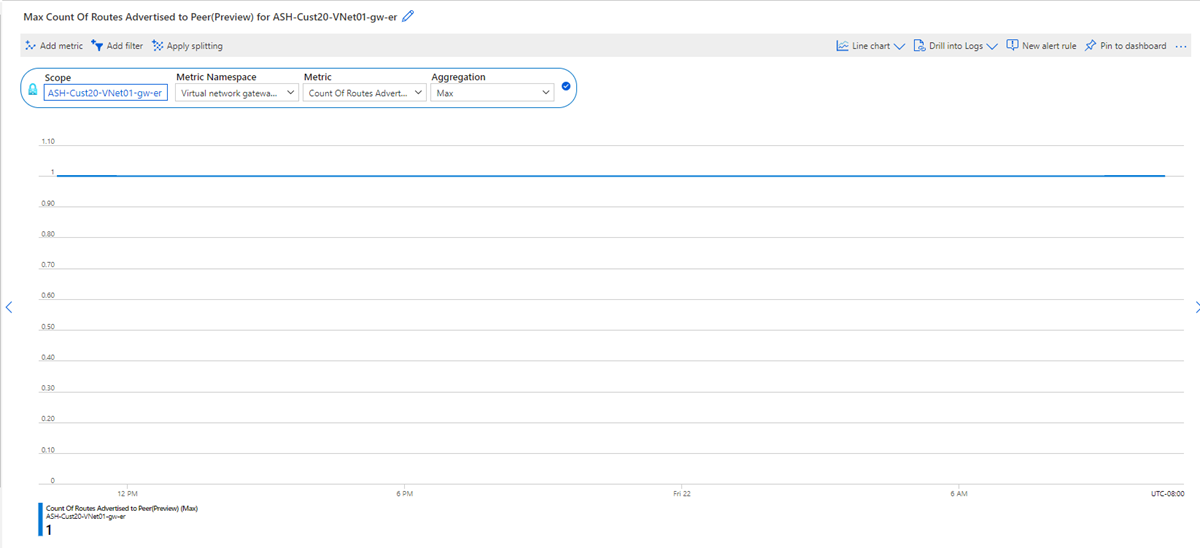
Count of Routes Advertised to Peer - Split by instance
Aggregation type: Max
This metric shows the number of routes the ExpressRoute gateway is advertising to the circuit. The address spaces might include virtual networks that are connected using virtual network peering and uses remote ExpressRoute gateway. You should expect the number of routes to remain consistent unless there are frequent changes to the virtual network address spaces. Set an alert for when the number of advertised routes drop below the threshold for the number of virtual network address spaces you're aware of.
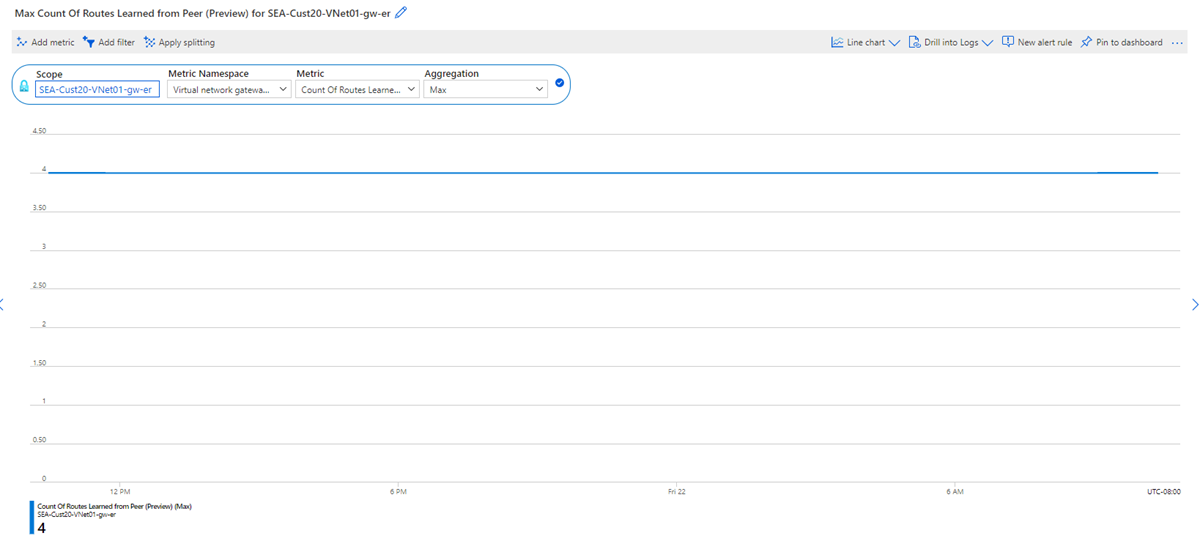
Count of routes learned from peer - Split by instance
Aggregation type: Max
This metric shows the number of routes the ExpressRoute gateway is learning from peers connected to the ExpressRoute circuit. These routes can be either from another virtual network connected to the same circuit or learned from on-premises. Set an alert for when the number of learned routes drop below a certain threshold. This metric can indicate either the gateway is seeing a performance problem or remote peers are no longer advertising routes to the ExpressRoute circuit.
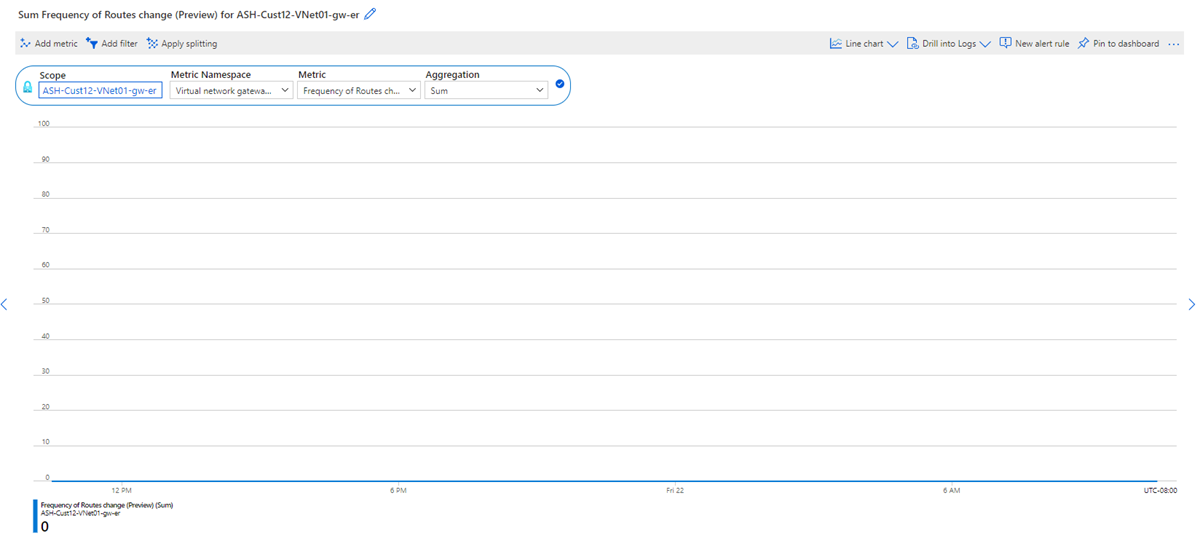
Frequency of routes change - Split by instance
Aggregation type: Sum
This metric shows the frequency of routes being learned from or advertised to remote peers. You should first investigate your on-premises devices to understand why the network is changing so frequently. A high frequency in routes change could indicate a performance problem on the ExpressRoute gateway where scaling the gateway SKU up might resolve the problem. Set an alert for a frequency threshold to be aware of when your ExpressRoute gateway is seeing abnormal route changes.
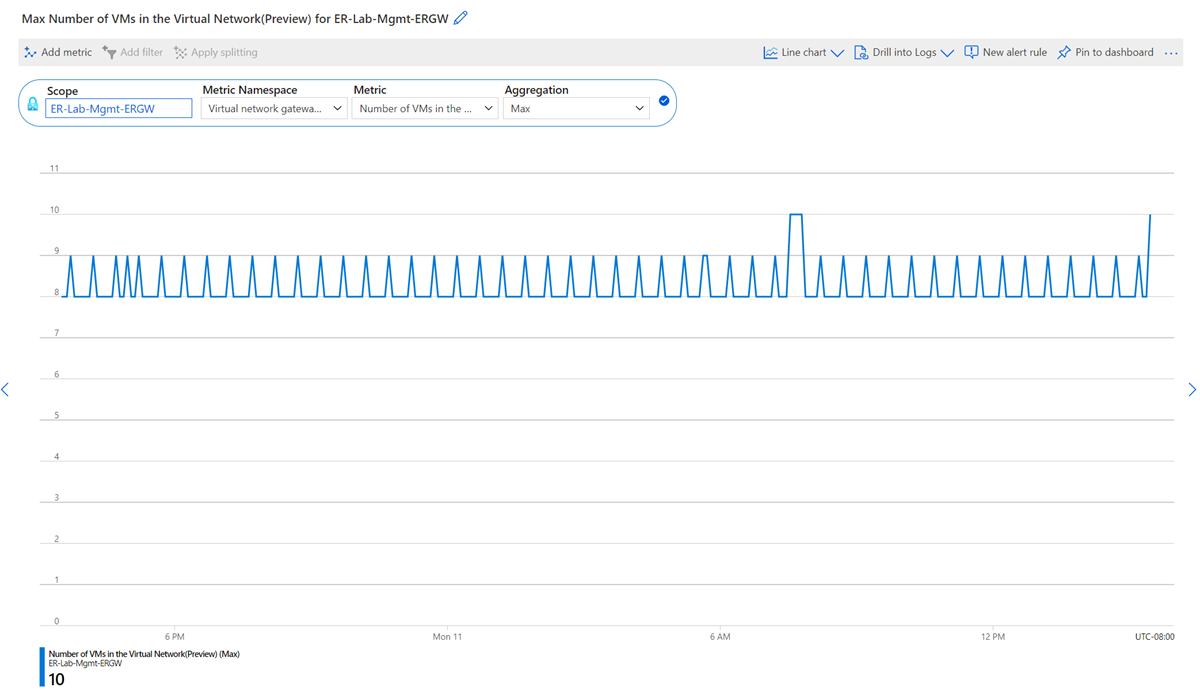
Number of VMs in the virtual network
Aggregation type: Max
This metric shows the number of virtual machines that are using the ExpressRoute gateway. The number of virtual machines might include VMs from peered virtual networks that use the same ExpressRoute gateway. Set an alert for this metric if the number of VMs goes above a certain threshold that could affect the gateway performance.
Note
To maintain reliability of the service, Microsoft often performs platform or OS maintenance on the gateway service. During this time, this metric may fluctuate and report inaccurately.
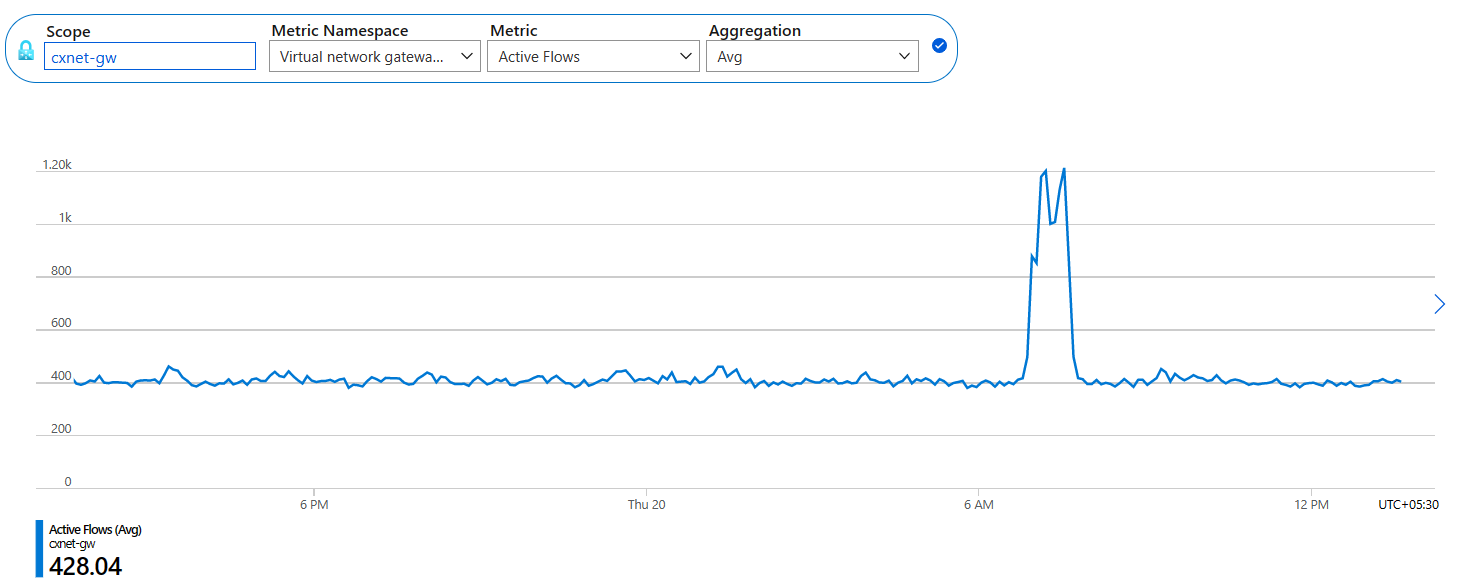
Active flows
Aggregation type: Avg
Split by: Gateway Instance
This metric displays a count of the total number of active flows on the ExpressRoute Gateway. Only inbound traffic from on-premises is captured for active flows. Through split at instance level, you can see active flow count per gateway instance. For more information, see understand network flow limits.
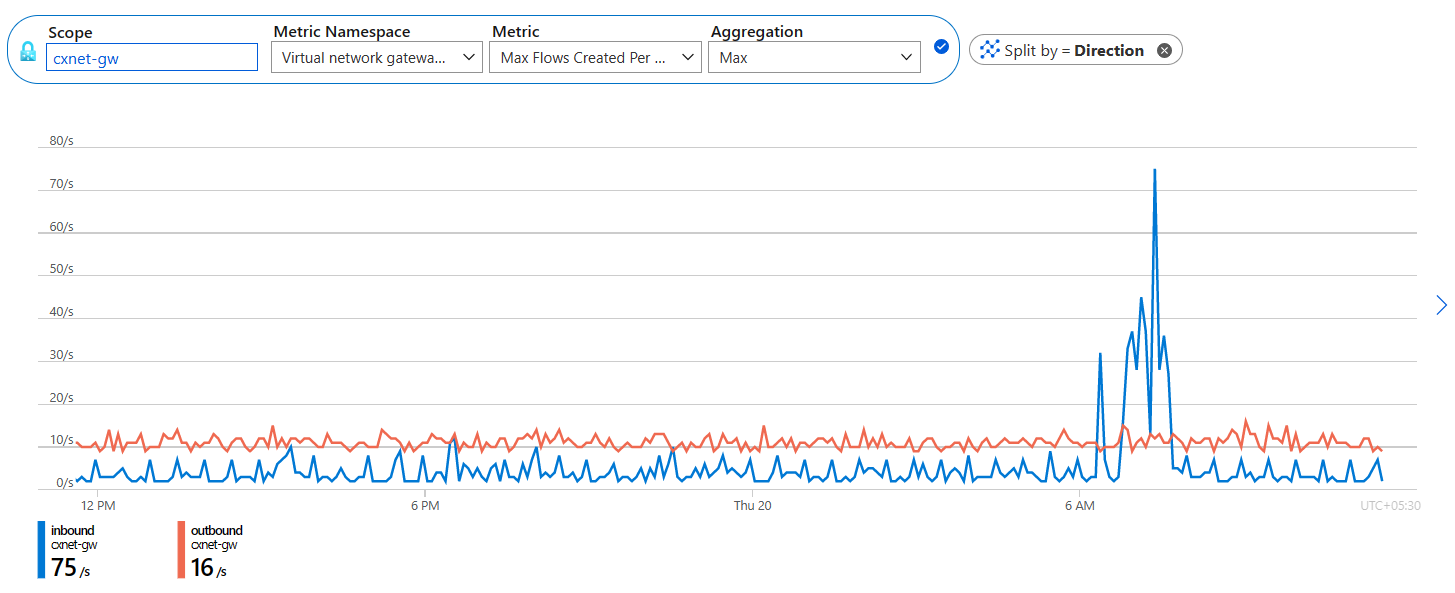
Max flows created per second
Aggregation type: Max
Split by: Gateway Instance and Direction (Inbound/Outbound)
This metric displays the maximum number of flows created per second on the ExpressRoute Gateway. Through split at instance level and direction, you can see max flow creation rate per gateway instance and inbound/outbound direction respectively. For more information, see understand network flow limits.
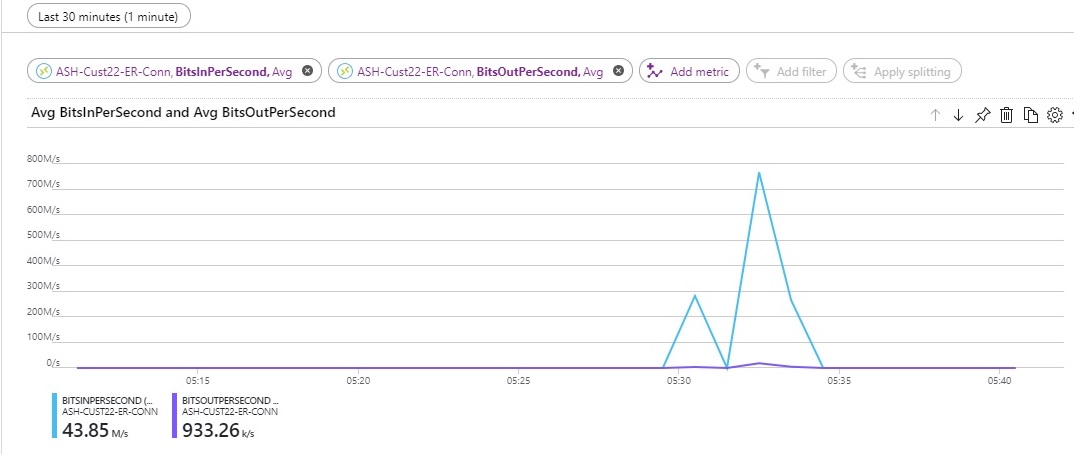
ExpressRoute gateway connections in bits/seconds
Aggregation type: Avg
This metric shows the bits per second for ingress and egress to Azure through the ExpressRoute gateway. You can split this metric further to see specific connections to the ExpressRoute circuit.
ExpressRoute Traffic Collector metrics
CPU Utilization - Split by instance
Aggregation type: Avg (of percentage of total utilized CPU)
Granularity: 5 min
You can view the CPU utilization of each ExpressRoute Traffic Collector instance. The CPU utilization might spike briefly during routine host maintenance, but prolonged high CPU utilization could indicate your ExpressRoute Traffic Collector is reaching a performance bottleneck.
Guidance: Set an alert for when avg CPU utilization exceeds a certain threshold.
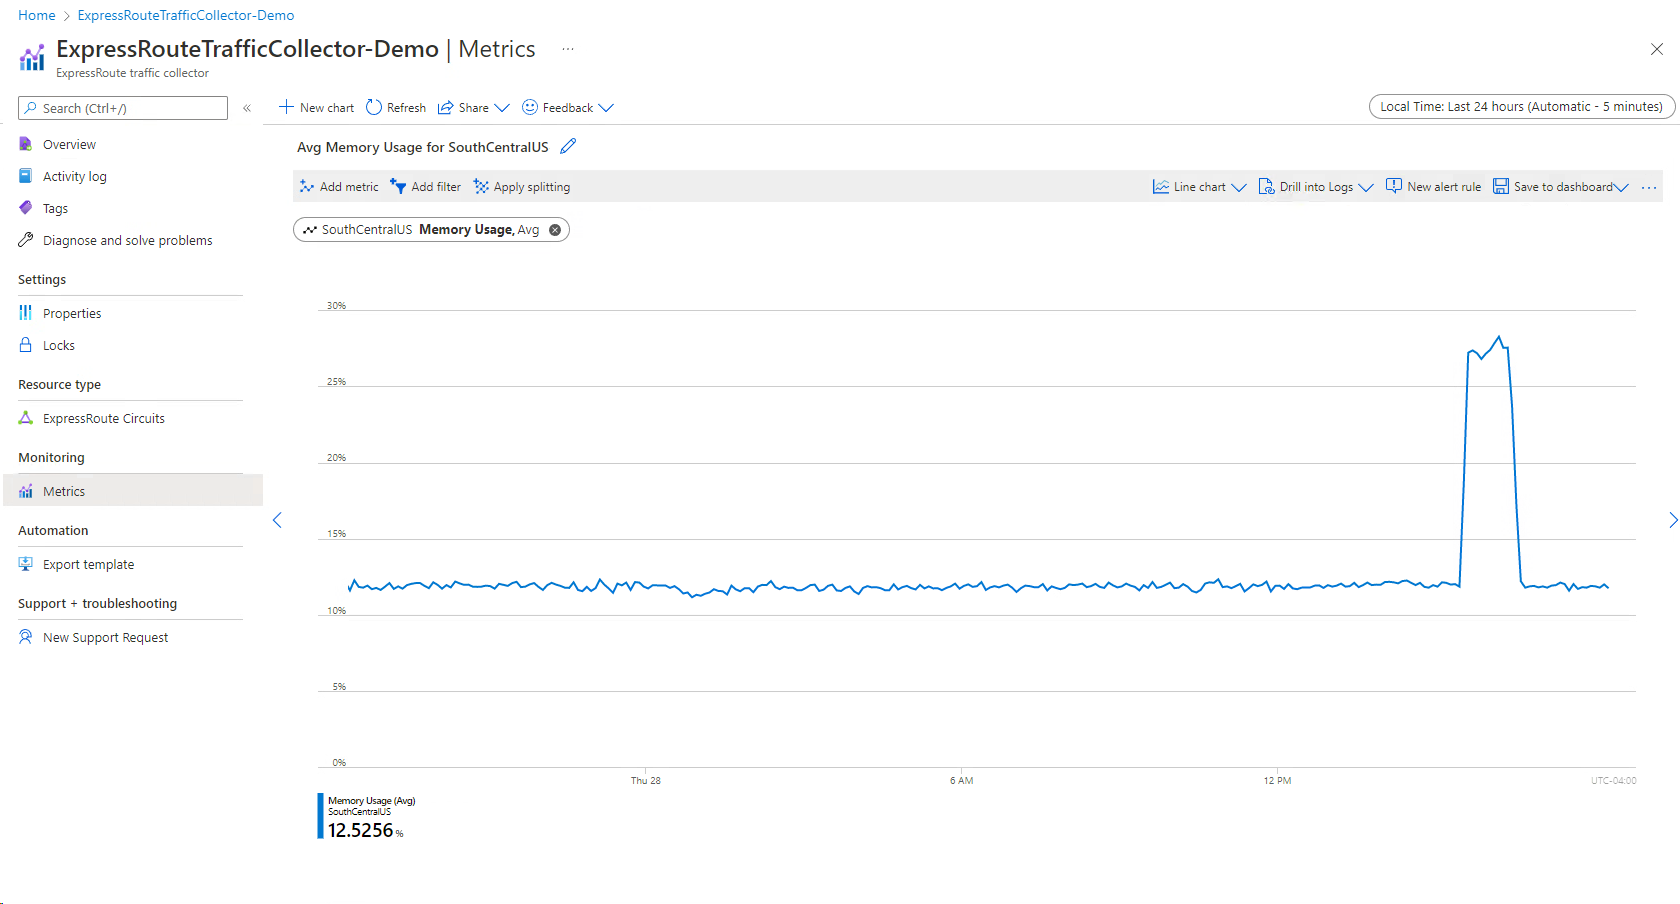
Memory Utilization - Split by instance
Aggregation type: Avg (of percentage of total utilized Memory)
Granularity: 5 min
You can view the memory utilization of each ExpressRoute Traffic Collector instance. Memory utilization might spike briefly during routine host maintenance, but prolonged high memory utilization could indicate your Azure Traffic Collector is reaching a performance bottleneck.
Guidance: Set an alert for when avg memory utilization exceeds a certain threshold.
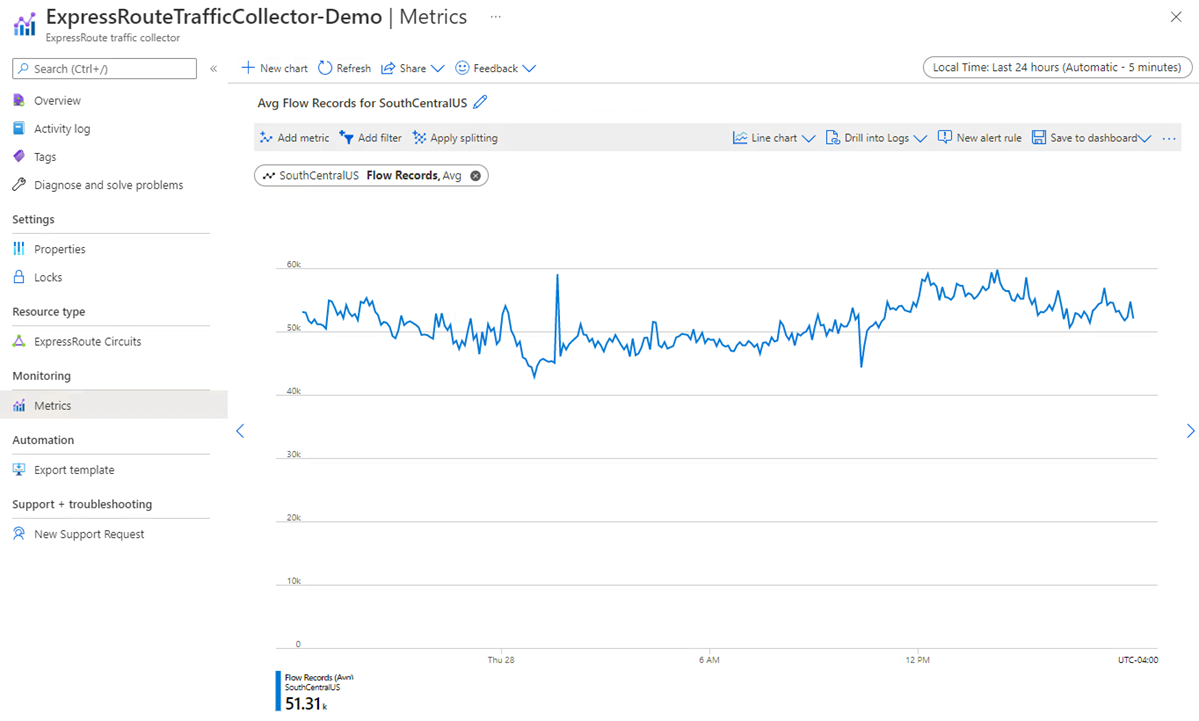
Count of flow records processed - Split by instances or ExpressRoute circuit
Aggregation type: Count
Granularity: 5 min
You can view the count of number of flow records processed by ExpressRoute Traffic Collector, aggregated across ExpressRoute Circuits. Customer can split the metrics across each ExpressRoute Traffic Collector instance or ExpressRoute circuit when multiple circuits are associated to the ExpressRoute Traffic Collector. Monitoring this metric helps you understand if you need to deploy more ExpressRoute Traffic Collector instances or migrate ExpressRoute circuit association from one ExpressRoute Traffic Collector deployment to another.
Guidance: Splitting by circuits is recommended when multiple ExpressRoute circuits are associated with an ExpressRoute Traffic Collector deployment. This metric helps determine the flow count of each ExpressRoute circuit and ExpressRoute Traffic Collector utilization by each ExpressRoute circuit.
Alerts for ExpressRoute gateway connections
To configure alerts, navigate to Azure Monitor, then select Alerts.

Select + Create > Alert rule and select the ExpressRoute gateway connection resource. Select Next: Condition > to configure the signal.
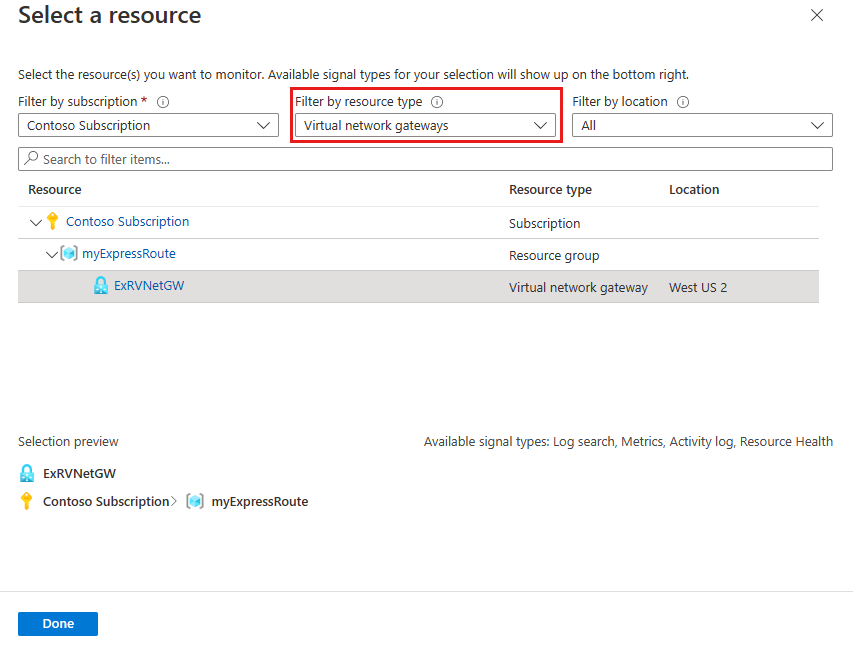
On the Select a signal page, select a metric, resource health, or activity log that you want to be alerted. Depending on the signal you select, you might need to enter additional information such as a threshold value. You can also combine multiple signals into a single alert. Select Next: Actions > to define who and how they get notify.

Select + Select action groups to choose an existing action group you previously created or select + Create action group to define a new one. In the action group, you determine how notifications get sent and who receives them.
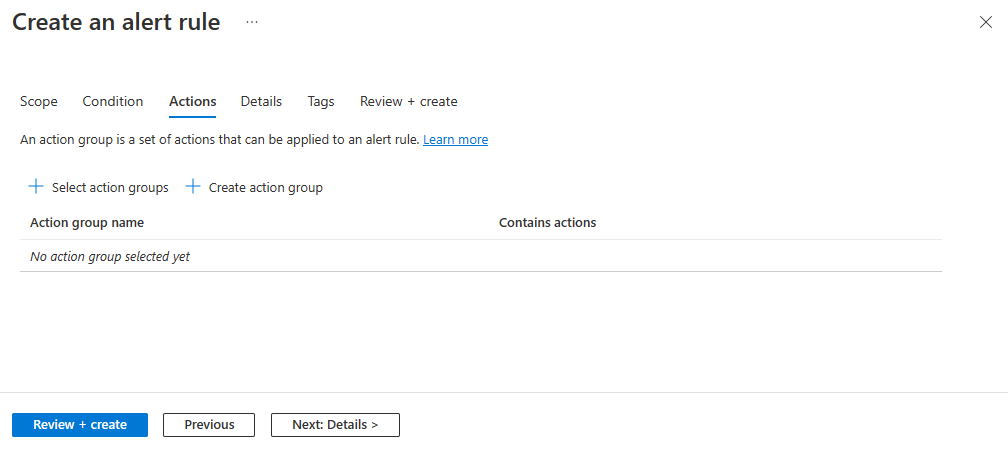
Select Review + create and then Create to deploy the alert into your subscription.
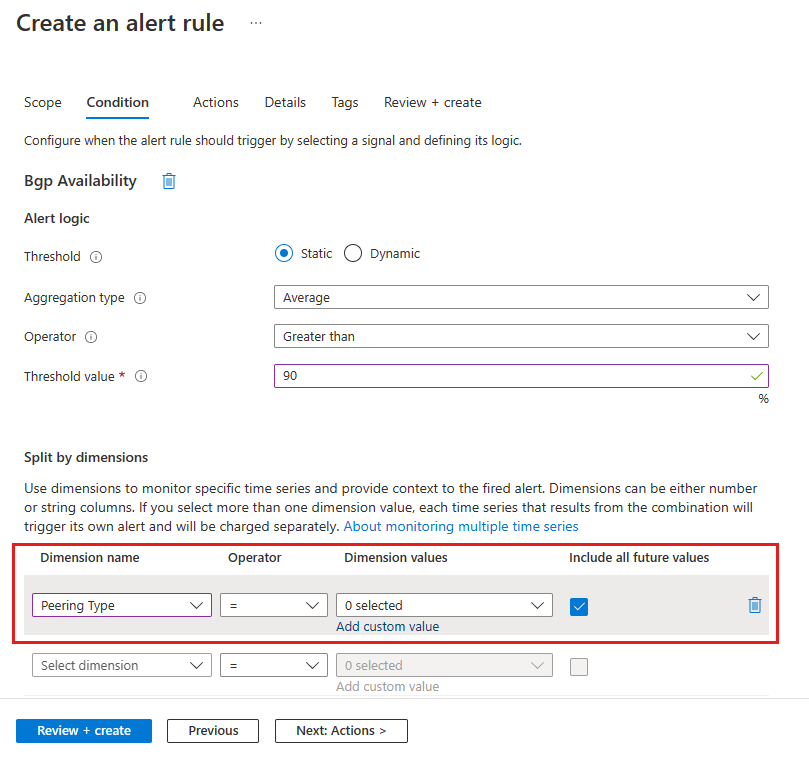
Alerts based on each peering
After you select a metric, certain metric allow you to set up dimensions based on peering or a specific peer (virtual networks).
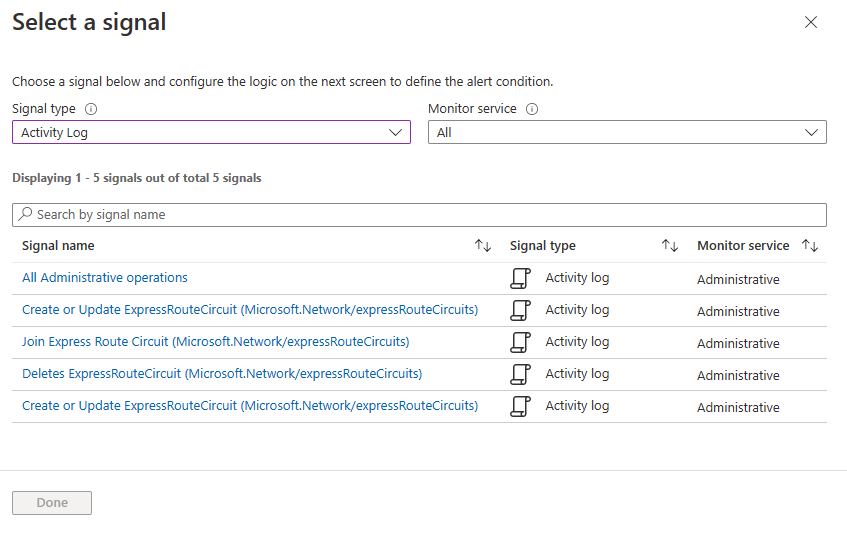
Configure alerts for activity logs on circuits
When selecting signals to be alerted on, you can select Activity Log signal type.
More metrics in Log Analytics
You can also view ExpressRoute metrics by going to your ExpressRoute circuit resource and selecting the Logs tab. For any metrics you query, the output contains the following columns.
| Column | Type | Description |
|---|---|---|
| TimeGrain | string | PT1M (metric values are pushed every minute) |
| Count | real | Usually is 2 (each MSEE pushes a single metric value every minute) |
| Minimum | real | The minimum of the two metric values pushed by the two MSEEs |
| Maximum | real | The maximum of the two metric values pushed by the two MSEEs |
| Average | real | Equal to (Minimum + Maximum)/2 |
| Total | real | Sum of the two metric values from both MSEEs (the main value to focus on for the metric queried) |
Next steps
Set up your ExpressRoute connection.
Feedback
Coming soon: Throughout 2024 we will be phasing out GitHub Issues as the feedback mechanism for content and replacing it with a new feedback system. For more information see: https://aka.ms/ContentUserFeedback.
Submit and view feedback for

