Manage HDInsight clusters by using the Apache Ambari Web UI
Apache Ambari simplifies the management and monitoring of an Apache Hadoop cluster. This simplification is done by providing an easy to use web UI and REST API. Ambari is included on HDInsight clusters, and is used to monitor the cluster and make configuration changes.
In this document, you learn how to use the Ambari Web UI with an HDInsight cluster.
What is Apache Ambari?
Apache Ambari simplifies Hadoop management by providing an easy-to-use web UI. You can use Ambari to manage and monitor Hadoop clusters. Developers can integrate these capabilities into their applications by using the Ambari REST APIs.
Connectivity
The Ambari Web UI is available on your HDInsight cluster at https://CLUSTERNAME.azurehdinsight.net, where CLUSTERNAME is the name of your cluster.
Important
Connecting to Ambari on HDInsight requires HTTPS. When prompted for authentication, use the admin account name and password you provided when the cluster was created. If you are not prompted for credentials, check your network settings to confirm there is no connectivity issue between the client and the Azure HDInsight Clusters.
SSH tunnel (proxy)
While Ambari for your cluster is accessible directly over the Internet, some links from the Ambari Web UI (such as to the JobTracker) aren't exposed on the internet. To access these services, you must create an SSH tunnel. For more information, see Use SSH Tunneling with HDInsight.
Ambari Web UI
Warning
Not all features of the Ambari Web UI are supported on HDInsight. For more information, see the Unsupported operations section of this document.
When connecting to the Ambari Web UI, you're prompted to authenticate to the page. Use the cluster admin user (default Admin) and password you used during cluster creation.
When the page opens, note the bar at the top. This bar contains the following information and controls:

| Item | Description |
|---|---|
| Ambari logo | Opens the dashboard, which can be used to monitor the cluster. |
| Cluster name # ops | Displays the number of ongoing Ambari operations. Selecting the cluster name or # ops displays a list of background operations. |
| # alerts | Displays warnings or critical alerts, if any, for the cluster. |
| Dashboard | Displays the dashboard. |
| Services | Information and configuration settings for the services in the cluster. |
| Hosts | Information and configuration settings for the nodes in the cluster. |
| Alerts | A log of information, warnings, and critical alerts. |
| Admin | Software stack/services that are installed on the cluster, service account information, and Kerberos security. |
| Admin button | Ambari management, user settings, and sign out. |
Monitoring
Alerts
The following list contains the common alert statuses used by Ambari:
- OK
- Warning
- CRITICAL
- UNKNOWN
Alerts other than OK cause the # alerts entry at the top of the page to display the number of alerts. Selecting this entry displays the alerts and their status.
Alerts are organized into several default groups, which can be viewed from the Alerts page.
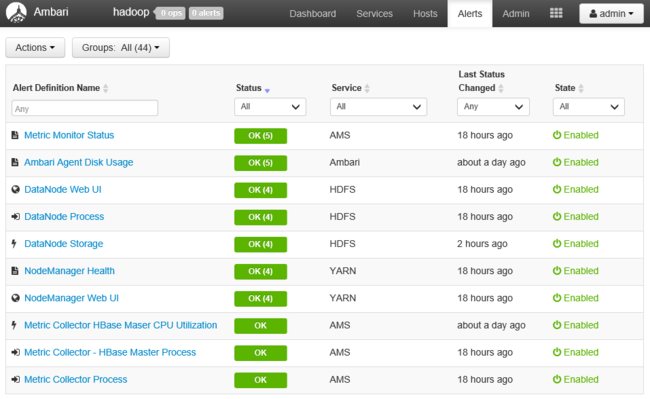
You can manage the groups by using the Actions menu and selecting Manage Alert Groups.
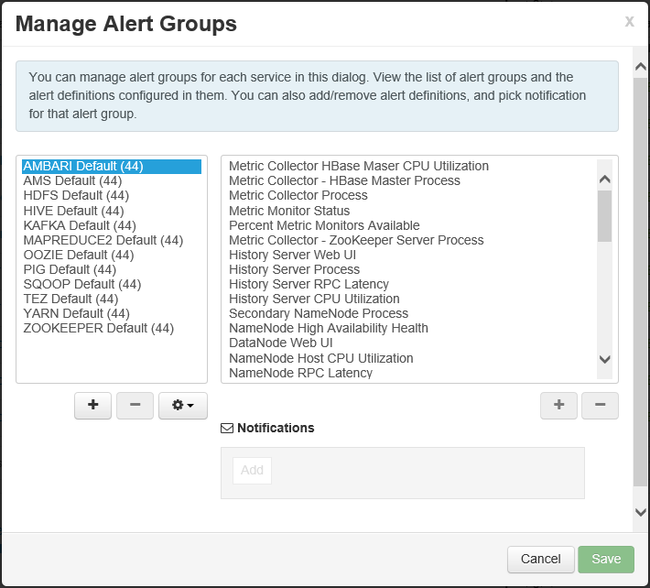
You manage alerting methods, and create alert notifications from the Actions menu by selecting Manage Notifications. Any current notifications are displayed. Create notifications from here. Notifications can be sent via EMAIL or SNMP when specific alert/severity combinations occur. For example, you can send an email message when any of the alerts in the YARN Default group is set to Critical.

Finally, selecting Manage Alert Settings from the Actions menu allows you to set the number of times an alert must occur before a notification is sent. This setting can be used to prevent notifications for transient errors.
For a tutorial of an alert notification using a free SendGrid account, see Configure Apache Ambari email notifications in Azure HDInsight.
Cluster
The Metrics tab of the dashboard contains a series of widgets that make it easy to monitor the status of your cluster at a glance. Several widgets, such as CPU Usage, provide additional information when clicked.

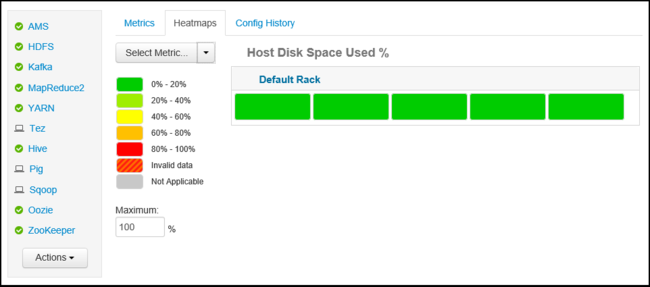
The Heatmaps tab displays metrics as colored heatmaps, going from green to red.
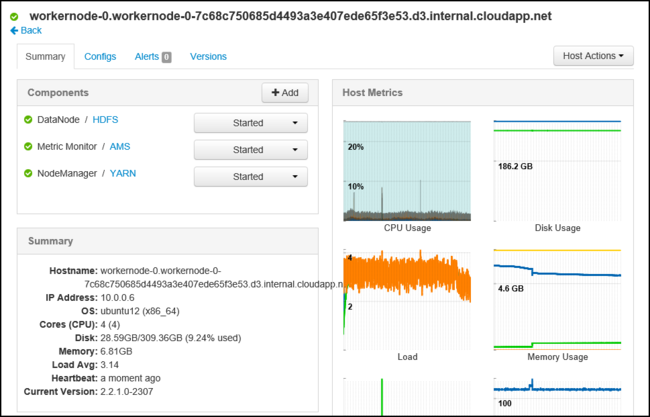
For more information on the nodes within the cluster, select Hosts. Then select the specific node you're interested in.
Services
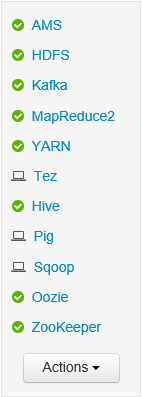
The Services sidebar on the dashboard provides quick insight into the status of the services running on the cluster. Various icons are used to indicate status or actions that should be taken. For example, a yellow recycle symbol is displayed if a service needs to be recycled.
Note
The services displayed differ between HDInsight cluster types and versions. The services displayed here may be different than the services displayed for your cluster.
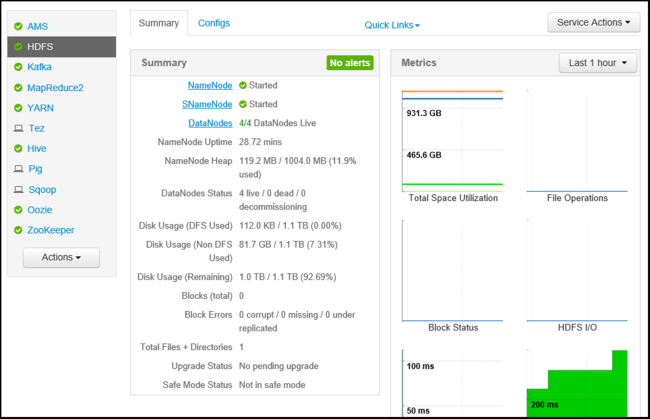
Selecting a service displays more detailed information on the service.
Quick links
Some services display a Quick Links link at the top of the page. This link can be used to access service-specific web UIs, such as:
- Job History - MapReduce job history.
- Resource Manager - YARN Resource Manager UI.
- NameNode - Hadoop Distributed File System (HDFS) NameNode UI.
- Oozie Web UI - Oozie UI.
Selecting any of these links opens a new tab in your browser, which displays the selected page.
Note
Selecting the Quick Links entry for a service may return a "server not found" error. If you encounter this error, you must use an SSH tunnel when using the Quick Links entry for this service. For information, see Use SSH Tunneling with HDInsight
Management
Ambari users, groups, and permissions
Working with users, groups, and permissions is supported. For local administration, see Authorize users for Apache Ambari Views. For domain-joined clusters, see Manage domain-joined HDInsight clusters.
Warning
Do not delete or change the password of the Ambari watchdog (hdinsightwatchdog) on your Linux-based HDInsight cluster. Changing the password breaks the ability to use script actions or perform scaling operations with your cluster.
Hosts
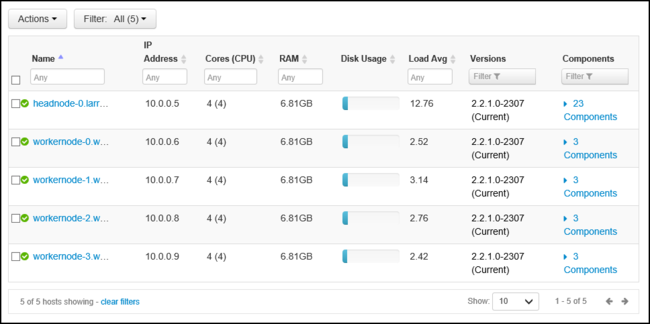
The Hosts page lists all hosts in the cluster. To manage hosts, follow these steps.
Note
Adding, decommissioning, and recommissioning a host should not be used with HDInsight clusters.
Select the host that you wish to manage.
Use the Actions menu to select the action that you wish to do:
Item Description Start all components Start all components on the host. Stop all components Stop all components on the host. Restart all components Stop and start all components on the host. Turn on maintenance mode Suppresses alerts for the host. This mode should be enabled if you're doing actions that generate alerts. For example, stopping and starting a service. Turn off maintenance mode Returns the host to normal alerting. Stop Stops DataNode or NodeManagers on the host. Start Starts DataNode or NodeManagers on the host. Restart Stops and starts DataNode or NodeManagers on the host. Decommission Removes a host from the cluster. Don't use this action on HDInsight clusters. Recommission Adds a previously decommissioned host to the cluster. Don't use this action on HDInsight clusters.
Services
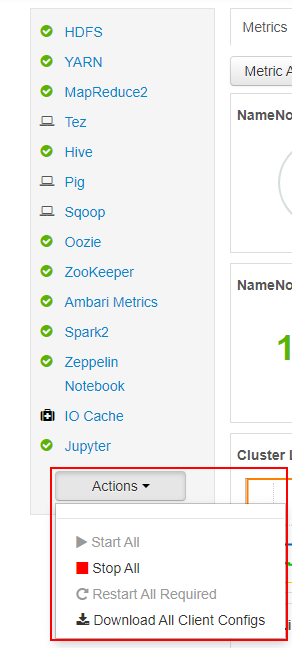
From the Dashboard or Services page, use the Actions button at the bottom of the list of services to stop and start all services.
Warning
New services should be added using a Script Action during cluster provisioning. For more information on using Script Actions, see Customize HDInsight clusters using Script Actions.
While the Actions button can restart all services, often you want to start, stop, or restart a specific service. Use the following steps to do actions on an individual service:
From the Dashboard or Services page, select a service.
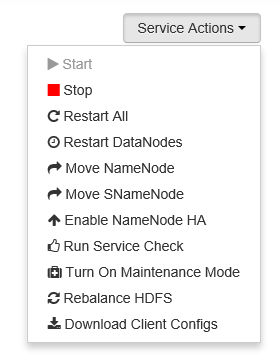
From the top of the Summary tab, use the Service Actions button and select the action to take. This action restarts the service on all nodes.
Note
Restarting some services while the cluster is running may generate alerts. To avoid alerts, you can use the Service Actions button to enable Maintenance mode for the service before performing the restart.
Once an action has been selected, the # op entry at the top of the page increments to show that a background operation is occurring. If configured to display, the list of background operations is displayed.
Note
If you enabled Maintenance mode for the service, remember to disable it by using the Service Actions button once the operation has finished.
To configure a service, use the following steps:
From the Dashboard or Services page, select a service.
Select the Configs tab. The current configuration is displayed. A list of previous configurations is also displayed.
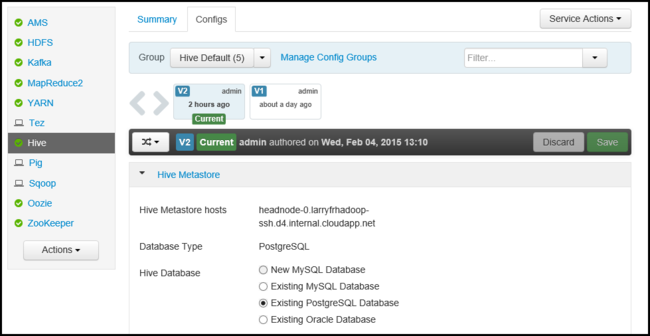
Use the fields displayed to modify the configuration, and then select Save. Or select a previous configuration and then select Make current to roll back to the previous settings.
Ambari views
Ambari Views allow developers to plug UI elements into the Ambari Web UI using the Apache Ambari Views Framework. HDInsight provides the following views with Hadoop cluster types:
Hive View: The Hive View allows you to run Hive queries directly from your web browser. You can save queries, view results, save results to the cluster storage, or download results to your local system. For more information on using Hive Views, see Use Apache Hive Views with HDInsight.
Tez View: The Tez View allows you to better understand and optimize jobs. You can view information on how Tez jobs are executed and what resources are used.
Unsupported operations
The following Ambari operations aren't supported on HDInsight:
- Moving the Metrics Collector service. When viewing information on the Metrics Collector service, one of the actions available from the Service Actions menu is Move Metrics collector. This action isn't supported with HDInsight.
Next steps
Feedback
Coming soon: Throughout 2024 we will be phasing out GitHub Issues as the feedback mechanism for content and replacing it with a new feedback system. For more information see: https://aka.ms/ContentUserFeedback.
Submit and view feedback for