Monitoring and diagnostics tools in Lifecycle Services (LCS)
Important
As part of the One Dynamics One Platform work effort, some Microsoft Dynamics 365 Lifecycle Services (LCS) features have been deprecated. For more information, see Removed or deprecated platform features.
This article describes the various tools that Microsoft Dynamics Lifecycle Services (LCS) provides to help you monitor, diagnose, and analyze the health of the finance and operations environments that you manage.
To have a successful onboarding experience to the cloud service, you must know the health of your environments at all times. You must also be able to troubleshoot any health issues that occur. Microsoft Dynamics Lifecycle Services (LCS), which is the administration center, contains a collection of monitoring and diagnostics tools that can help to ensure that you have an accurate view of the environments that you manage.
Telemetry data
The telemetry data that is the basis of the Monitoring and diagnostics portal in LCS has three primary use cases: monitoring, diagnostics, and analytics.
Monitoring
In business operations software, you should always know whether your environment is up and running, so that it can perform business operations. You should also be able to easily view the health of the environment through LCS. Microsoft supports the following monitoring capabilities:
- Health monitoring – In addition to availability checks, some basic health checks must be performed. These health checks span various components, such as Application Object Server (AOS), Batch Framework, Data Management Framework, Microsoft Azure SQL, and Management Reporter. These checks are done based on multiple data sources, such as the telemetry that is collected from the environments, checks that are done by a watchdog service that continuously monitors the environment, and CPU counters and other system-level counters that the environment emits. Some health checks are self-healing and are mitigated immediately. However, other health checks are reported to the Microsoft Service Engineering team for investigation.
Diagnostics
When a user reports an issue, you can use various tools in LCS for troubleshooting. The rich set of telemetry data helps you build a storyboard view that shows what that user and other users were doing when the issue was reported.
Analytics
Analytics is another critical use case for the telemetry data that is collected. Currently, only Microsoft can perform analytics, so that it can gauge and understand feature usage and performance through Microsoft Power BI.
Responsibilities
For a managed cloud service such as finance and operations, Microsoft is responsible for actively monitoring the health of production environments at all times. If a customer's environment is affected by an issue, the Microsoft Service Engineering team is immediately alerted. The team will start to investigate the issue and will work with you to find a resolution.
Access the Monitoring and diagnostics portal
- Open LCS, and navigate to the appropriate project.
- In the Environments section, select the environment to view, and then select Full details.
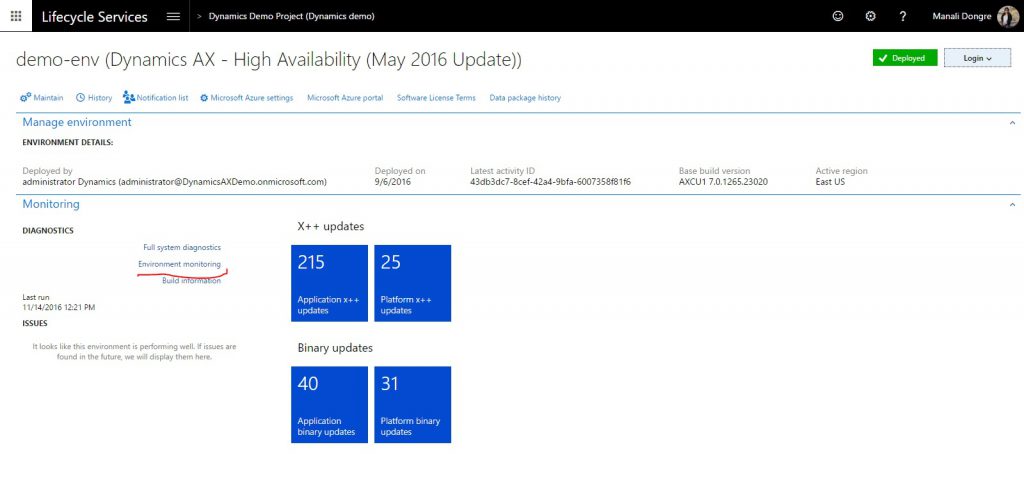
- On the environment details page, select Environment monitoring to open the Monitoring and diagnostics portal.
Tools
Several tools and resources are available in the Monitoring and diagnostics portal.
Note
Not all environments contain all the tools. The following table shows the tools that are available for each type of environment.
| Environment type | Tools |
|---|---|
| Production systems |
|
| User acceptance testing (UAT)/sandbox |
|
| Demo/build |
|
| Environments deployed in customer/partner subscriptions |
|
Monitoring dashboard
On the Environment monitoring page, select the Health metrics tab to view the Monitoring dashboard. Health metrics are collected for every machine and component. These health metrics include CPU usage, available memory, errors logged per second, and batch heartbeat. You're alerted about any abnormalities in the metrics. Although some alerts are self-healing, the Microsoft Service Engineering team will investigate the cause of other alerts and then take action to mitigate them. You can view the health monitors for a specific area to see what is occurring.
Activity monitoring
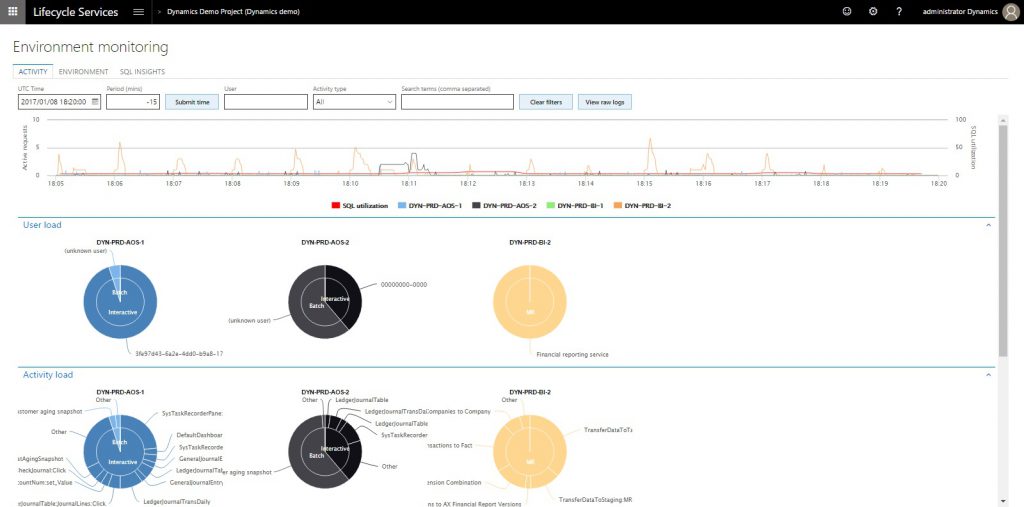
On the Environment monitoring page, select the Activity tab to use the Activity monitoring tool. This tool provides a storyboard view that shows what you or another user was doing during a specific period.
- The User load section shows all the system users. Each chart shows the time that the user spent on a specific machine.
- The Activity load section shows the activities that were performed on each machine. If you hover over an activity, you see the Form:Control:Action as a tuple. For example, if you look at LedgerJournal:New:Click in this section, you can see that user A opened the LedgerJournals page and selected the New button to create a new journal entry.
- The User activity grid shows the various activities that users performed, based on their session timestamp.
You can use the filters on this page to narrow the information logs. Here are some of the filters that are available:
- Time duration – Go back 60 minutes from the selected date and time.
- User – View a specific user's activities.
- Search terms – Create a search that is based on the issue that is being investigated.
Note
The page doesn't load data by default. To load the data that is required in order to show the page, you must select the time duration and then select Submit time.
Important
The Activity monitoring tool retains data for only 30 days.
Raw information logs
For advanced troubleshooting, you can view raw information logs. You can use a set of predefined queries to get raw logs for an issue. You can then export the logs to do more advanced analysis. The following types of queries are available:
- Long queries
- Deadlocks
- Crashes
- Financial reporting issues
For information about how to use Azure Data Explorer with raw information logs, see Use Azure Data Explorer to query raw information logs.
SQL insights
The Monitoring and diagnostics portal also includes advanced SQL troubleshooting tools to enable performance analysis. For more details, see Performance troubleshooting using tools in Lifecycle Services (LCS).
Feedback
Coming soon: Throughout 2024 we will be phasing out GitHub Issues as the feedback mechanism for content and replacing it with a new feedback system. For more information see: https://aka.ms/ContentUserFeedback.
Submit and view feedback for


