.NET observability with OpenTelemetry
When you run an application, you want to know how well the app is performing and to detect potential problems before they become larger. You can do this by emitting telemetry data such as logs or metrics from your app, then monitoring and analyzing that data.
What is observability?
Observability in the context of a distributed system is the ability to monitor and analyze telemetry about the state of each component, to be able to observe changes in performance, and to diagnose why those changes occur. Unlike debugging, which is invasive and can affect the operation of the application, observability is intended to be transparent to the primary operation and have a small enough performance impact that it can be used continuously.
Observability is commonly done using a combination of:
- Logs, which record individual operations, such as an incoming request, a failure in a specific component, or an order being placed.
- Metrics, which are measuring counters and gauges such as number of completed requests, active requests, widgets that have been sold; or a histogram of the request latency.
- Distributed tracing, which tracks requests and activities across components in a distributed system so that you can see where time is spent and track down specific failures.
Together, logs, metrics, and distributed tracing are known as the three pillars of observability.
Each pillar might include telemetry data from:
- The .NET runtime, such as the garbage collector or JIT compiler.
- Libraries, such as from Kestrel (the ASP.NET web server) and
HttpClient. - Application-specific telemetry that's emitted by your code.
Observability approaches in .NET
There are a few different ways to achieve observability in .NET applications:
- Explicitly in code, by referencing and using a library such as OpenTelemetry. If you have access to the source code and can rebuild the app, then this is the most powerful and configurable mechanism.
- Out-of-process using EventPipe. Tools such as dotnet-monitor can listen to logs and metrics and then process them without affecting any code.
- Using a startup hook, assemblies can be injected into the process that can then collect instrumentation. An example of this approach is OpenTelemetry .NET Automatic Instrumentation.
What is OpenTelemetry?
OpenTelemetry (OTel) is a cross-platform, open standard for collecting and emitting telemetry data. OpenTelemetry includes:
- APIs for libraries to use to record telemetry data as code is running.
- APIs that app developers use to configure what portion of the recorded data will be sent across the network, where it will be sent to, and how it may be filtered, buffered, enriched, and transformed.
- Semantic conventions provide guidance on naming and content of telemetry data. It is important for the apps that produce telemetry data and the tools that receive the data to agree on what different kinds of data means and what sorts of data are useful so that the tools can provide effective analysis.
- An interface for exporters. Exporters are plugins that allow telemetry data to be transmitted in specific formats to different telemetry backends.
- OTLP wire protocol is a vendor neutral network protocol option for transmitting telemetry data. Some tools and vendors support this protocol in addition to pre-existing proprietary protocols they may have.
Using OTel enables the use of a wide variety of APM systems including open-source systems such as Prometheus and Grafana, Azure Monitor - Microsoft's APM product in Azure, or from the many APM vendors that partner with OpenTelemetry.
There are OpenTelemetry implementations for most languages and platforms, including .NET.
.NET implementation of OpenTelemetry
The .NET OpenTelemetry implementation is a little different from other platforms, as .NET provides logging, metrics, and activity APIs in the framework. That means OTel doesn't need to provide APIs for library authors to use. The .NET OTel implementation uses these platform APIs for instrumentation:
- Microsoft.Extensions.Logging.ILogger<TCategoryName> for logging
- System.Diagnostics.Metrics.Meter for metrics
- System.Diagnostics.ActivitySource and System.Diagnostics.Activity for distributed tracing
Where OTel comes into play is that it collects telemetry from those APIs and other sources (via instrumentation libraries) and then exports them to an application performance monitoring (APM) system for storage and analysis. The benefit that OTel brings as an industry standard is a common mechanism for collection, common schemas and semantics for telemetry data, and an API for how APMs can integrate with OTel. Using OTel means that applications don't need to use APM-specific APIs or data structures; they work against the OTel standard. APMs can either implement an APM specific exporter component or use OTLP, which is a new wire standard for exporting telemetry data to the APM systems.
OpenTelemetry packages
OpenTelemetry in .NET is implemented as a series of NuGet packages that form a couple of categories:
- Core API
- Instrumentation - these packages collect instrumentation from the runtime and common libraries.
- Exporters - these interface with APM systems such as Prometheus, Jaeger, and OTLP.
The following table describes the main packages.
| Package Name | Description |
|---|---|
| OpenTelemetry | Main library that provides the core OTEL functionality |
| OpenTelemetry.Instrumentation.AspNetCore | Instrumentation for ASP.NET Core and Kestrel |
| OpenTelemetry.Instrumentation.GrpcNetClient | Instrumentation for gRPC Client for tracking outbound gRPC calls |
| OpenTelemetry.Instrumentation.Http | Instrumentation for HttpClient and HttpWebRequest to track outbound HTTP calls |
| OpenTelemetry.Instrumentation.SqlClient | Instrumentation for SqlClient used to trace database operations |
| OpenTelemetry.Exporter.Console | Exporter for the console, commonly used to diagnose what telemetry is being exported |
| OpenTelemetry.Exporter.OpenTelemetryProtocol | Exporter using the OTLP protocol |
| OpenTelemetry.Exporter.Prometheus.AspNetCore | Exporter for Prometheus implemented using an ASP.NET Core endpoint |
| OpenTelemetry.Exporter.Zipkin | Exporter for Zipkin tracing |
Example: Use Prometheus, Grafana, and Jaeger
This example uses Prometheus for metrics collection, Grafana for creating a dashboard, and Jaeger to show distributed tracing.
1. Create the project
Create a simple web API project by using the ASP.NET Core Empty template in Visual Studio or the following .NET CLI command:
dotnet new web
2. Add metrics and activity definitions
The following code defines a new metric (greetings.count) for the number of times the API has been called, and a new activity source (OtPrGrYa.Example).
// Custom metrics for the application
var greeterMeter = new Meter("OtPrGrYa.Example", "1.0.0");
var countGreetings = greeterMeter.CreateCounter<int>("greetings.count", description: "Counts the number of greetings");

// Custom ActivitySource for the application
var greeterActivitySource = new ActivitySource("OtPrGrJa.Example");
3. Create an API endpoint
app.MapGet("/", SendGreeting);
async Task<String> SendGreeting(ILogger<Program> logger)
{
    // Create a new Activity scoped to the method
    using var activity = greeterActivitySource.StartActivity("GreeterActivity");

    // Log a message
    logger.LogInformation("Sending greeting");

    // Increment the custom counter
    countGreetings.Add(1);

    // Add a tag to the Activity
    activity?.SetTag("greeting", "Hello World!");

    return "Hello World!";
}
Note
The API definition does not use anything specific to OpenTelemetry. It uses the .NET APIs for observability.
4. Reference the OpenTelemetry packages
Use the NuGet Package Manager or command line to add the following NuGet packages:
<ItemGroup>
   <PackageReference Include="OpenTelemetry.Exporter.Console" Version="1.5.0" />
   <PackageReference Include="OpenTelemetry.Exporter.OpenTelemetryProtocol" Version="1.5.0" />
   <PackageReference Include="OpenTelemetry.Exporter.Prometheus.AspNetCore" Version="1.5.0-rc.1" />
   <PackageReference Include="OpenTelemetry.Extensions.Hosting" Version="1.5.0" />
   <PackageReference Include="OpenTelemetry.Instrumentation.AspNetCore" Version="1.5.0-beta.1" />
   <PackageReference Include="OpenTelemetry.Instrumentation.Http" Version="1.5.0-beta.1" />
</ItemGroup>
Note
Use the latest versions, as the OTel APIs are constantly evolving.
5. Configure OpenTelemetry with the correct providers
var tracingOtlpEndpoint = builder.Configuration["OTLP_ENDPOINT_URL"];
var otel = builder.Services.AddOpenTelemetry();

// Configure OpenTelemetry Resources with the application name
otel.ConfigureResource(resource => resource
    .AddService(serviceName: builder.Environment.ApplicationName));

// Add Metrics for ASP.NET Core and our custom metrics and export to Prometheus
otel.WithMetrics(metrics => metrics
    // Metrics provider from OpenTelemetry
    .AddAspNetCoreInstrumentation()
    .AddMeter(greeterMeter.Name)
    // Metrics provides by ASP.NET Core in .NET 8
    .AddMeter("Microsoft.AspNetCore.Hosting")
    .AddMeter("Microsoft.AspNetCore.Server.Kestrel")
    .AddPrometheusExporter());

// Add Tracing for ASP.NET Core and our custom ActivitySource and export to Jaeger
otel.WithTracing(tracing =>
{
    tracing.AddAspNetCoreInstrumentation();
    tracing.AddHttpClientInstrumentation();
    tracing.AddSource(greeterActivitySource.Name);
    if (tracingOtlpEndpoint != null)
    {
        tracing.AddOtlpExporter(otlpOptions =>
         {
             otlpOptions.Endpoint = new Uri(tracingOtlpEndpoint);
         });
    }
    else
    {
        tracing.AddConsoleExporter();
    }
});
This code uses ASP.NET Core instrumentation to get metrics and activities from ASP.NET Core. It also registers the Metrics and ActivitySource providers for metrics and tracing respectively.
The code uses the Prometheus exporter for metrics, which uses ASP.NET Core to host the endpoint, so you also need to add:
// Configure the Prometheus scraping endpoint
app.MapPrometheusScrapingEndpoint();
6. Run the project
Run the project and then access the API with the browser or curl.
curl -k http://localhost:7275
Each time you request the page, it will increment the count for the number of greetings that have been made. You can access the metrics endpoint using the same base url, with the path /metrics.
6.1 Log output
The logging statements from the code are output using ILogger. By default, the Console Provider is enabled so that output is directed to the console.
There are a couple of options for how logs can be egressed from .NET:
stdoutandstderroutput is redirected to log files by container systems such as Kubernetes.- Using logging libraries that will integrate with ILogger, these include Serilog or NLog.
- Using logging providers for OTel such as OTLP or the Azure Monitor exporter shown further below.
6.2 Access the metrics
You can access the metrics using the /metrics endpoint.
curl -k https://localhost:7275/
Hello World!

curl -k https://localhost:7275/metrics
# TYPE greetings_count counter
# HELP greetings_count Counts the number of greetings
greetings_count 1 1686894204856

# TYPE current_connections gauge
# HELP current_connections Number of connections that are currently active on the server.
current_connections{endpoint="127.0.0.1:7275"} 1 1686894204856
current_connections{endpoint="[::1]:7275"} 0 1686894204856
current_connections{endpoint="[::1]:5212"} 1 1686894204856
...
The metrics output is a snapshot of the metrics at the time the endpoint is requested. The results are provided in Prometheus exposition format, which is human readable but better understood by Prometheus. That topic is covered in the next stage.
6.3 Access the tracing
If you look at the console for the server, you'll see the output from the console trace exporter, which outputs the information in a human readable format. This should show two activities, one from your custom ActivitySource, and the other from ASP.NET Core:
Activity.TraceId:            2e00dd5e258d33fe691b965607b91d18
Activity.SpanId:             3b7a891f55b97f1a
Activity.TraceFlags:         Recorded
Activity.ParentSpanId:       645071fd0011faac
Activity.ActivitySourceName: OtPrGrYa.Example
Activity.DisplayName:        GreeterActivity
Activity.Kind:               Internal
Activity.StartTime:          2023-06-16T04:50:26.7675469Z
Activity.Duration:           00:00:00.0023974
Activity.Tags:
    greeting: Hello World!
Resource associated with Activity:
    service.name: OTel-Prometheus-Grafana-Jaeger
    service.instance.id: e1afb619-bc32-48d8-b71f-ee196dc2a76a
    telemetry.sdk.name: opentelemetry
    telemetry.sdk.language: dotnet
    telemetry.sdk.version: 1.5.0

Activity.TraceId:            2e00dd5e258d33fe691b965607b91d18
Activity.SpanId:             645071fd0011faac
Activity.TraceFlags:         Recorded
Activity.ActivitySourceName: Microsoft.AspNetCore
Activity.DisplayName:        /
Activity.Kind:               Server
Activity.StartTime:          2023-06-16T04:50:26.7672615Z
Activity.Duration:           00:00:00.0121259
Activity.Tags:
    net.host.name: localhost
    net.host.port: 7275
    http.method: GET
    http.scheme: https
    http.target: /
    http.url: https://localhost:7275/
    http.flavor: 1.1
    http.user_agent: curl/8.0.1
    http.status_code: 200
Resource associated with Activity:
    service.name: OTel-Prometheus-Grafana-Jaeger
    service.instance.id: e1afb619-bc32-48d8-b71f-ee196dc2a76a
    telemetry.sdk.name: opentelemetry
    telemetry.sdk.language: dotnet
    telemetry.sdk.version: 1.5.0
The first is the inner custom activity you created. The second is created by ASP.NET for the request and includes tags for the HTTP request properties. You will see that both have the same TraceId, which identifies a single transaction and in a distributed system can be used to correlate the traces from each service involved in a transaction. The IDs are transmitted as HTTP headers. ASP.NET Core assigns a TraceId if none is present when it receives a request. HttpClient includes the headers by default on outbound requests. Each activity has a SpanId, which is the combination of TraceId and SpanId that uniquely identify each activity. The Greeter activity is parented to the HTTP activity through its ParentSpanId, which maps to the SpanId of the HTTP activity.
In a later stage, you'll feed this data into Jaeger to visualize the distributed traces.
7. Collect metrics with Prometheus
Prometheus is a metrics collection, aggregation, and time-series database system. You configure it with the metric endpoints for each service and it periodically scrapes the values and stores them in its time-series database. You can then analyze and process them as needed.
The metrics data that's exposed in Prometheus format is a point-in-time snapshot of the process's metrics. Each time a request is made to the metrics endpoint, it will report the current values. While current values are interesting, they become more valuable when compared to historical values to see trends and detect if values are anomalous. Commonly, services have usage spikes based on the time of day or world events, such a shopping spree on Black Friday. By comparing the values against historical trends, you can detect if they are abnormal, or if a metric is slowly getting worse over time.
The process doesn't store any history of these metric snapshots. Adding that capability to the process could be resource intensive. Also, in a distributed system you commonly have multiple instances of each node, so you want to be able to collect the metrics from all of them and then aggregate and compare with their historical values.
7.1 Install and configure Prometheus
Download Prometheus for your platform from https://prometheus.io/download/ and extract the contents of the download.
Look at the top of the output of your running server to get the port number for the http endpoint. For example:
info: Microsoft.Hosting.Lifetime[14]
      Now listening on: https://localhost:7275
info: Microsoft.Hosting.Lifetime[14]
      Now listening on: http://localhost:5212
Modify the Prometheus YAML configuration file to specify the port for your HTTP scraping endpoint and set a lower scraping interval. For example:
  scrape_configs:
  # The job name is added as a label `job=<job_name>` to any timeseries scraped from this config.
  - job_name: "prometheus"
    - scrape_interval: 1s # poll very quickly for a more responsive demo

    # metrics_path defaults to '/metrics'
    # scheme defaults to 'http'.

    scrape_interval: 1s # poll very quickly for a more responsive demo
    static_configs:
      - targets: ["localhost:5212"]
Start Prometheus, and look in the output for the port it's running on, typically 9090:
>prometheus.exe
...
ts=2023-06-16T05:29:02.789Z caller=web.go:562 level=info component=web msg="Start listening for connections" address=0.0.0.0:9090
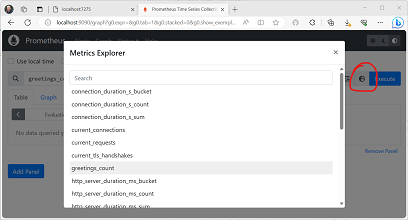
Open this URL in your browser. In the Prometheus UI you should now be able to query for your metrics. Use the highlighted button in the following image to open the metrics explorer, which shows all the available metrics.
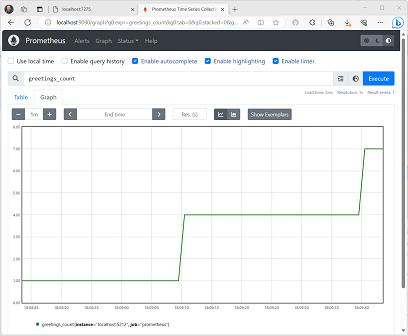
Select the greetings_count metric to see a graph of values.
8. Use Grafana to create a metrics dashboard
Grafana is a dashboarding product that can create dashboards and alerts based on Prometheus or other data sources.
Download and install the OSS version of Grafana from https://grafana.com/oss/grafana/ following the instructions for your platform. Once installed, Grafana is typically run on port 3000, so open http://localhost:3000 in your browser. You will need to log in; the default username and password are both admin.
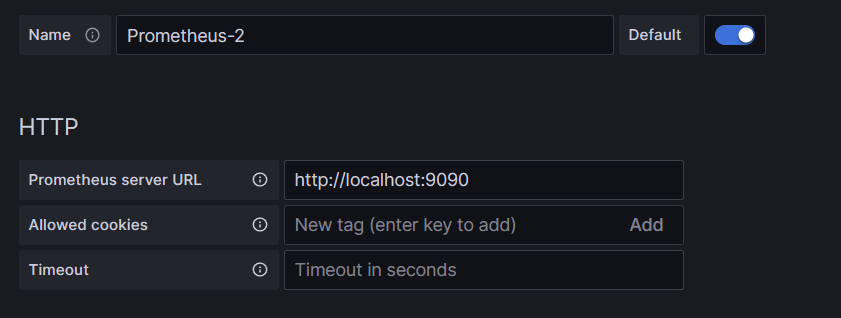
From the hamburger menu choose connections, and then enter the text prometheus to select your endpoint type. Select Create a Prometheus data source to add a new data source.
You need to set the following properties:
- Prometheus server URL:
http://localhost:9090/changing the port as applicable
Select Save & Test to verify the configuration.
Once you get a success message, you can configure a dashboard. Click the building a dashboard link shown in the popup for the success message.
Select Add a Visualization, and then choose the Prometheus data source you just added as the data source.
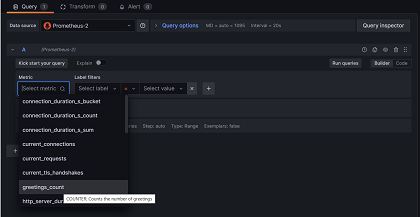
The dashboard panel designer should appear. In the lower half of the screen, you can define the query.
Select the greetings_count metric, and then select Run Queries to see the results.
With Grafana, you can design sophisticated dashboards that will track any number of metrics.
Each metric in .NET can have additional dimensions, which are key-value pairs that can be used to partition the data. The ASP.NET metrics all feature a number of dimensions applicable to the counter. For example, the current-requests counter from Microsoft.AspNetCore.Hosting has the following dimensions:
| Attribute | Type | Description | Examples | Presence |
|---|---|---|---|---|
method |
string |
HTTP request method. | GET; POST; HEAD |
Always |
scheme |
string |
The URI scheme identifying the used protocol. | http; https |
Always |
host |
string |
Name of the local HTTP server that received the request. | localhost |
Always |
port |
int |
Port of the local HTTP server that received the request. | 8080 |
Added if not default (80 for http or 443 for https) |
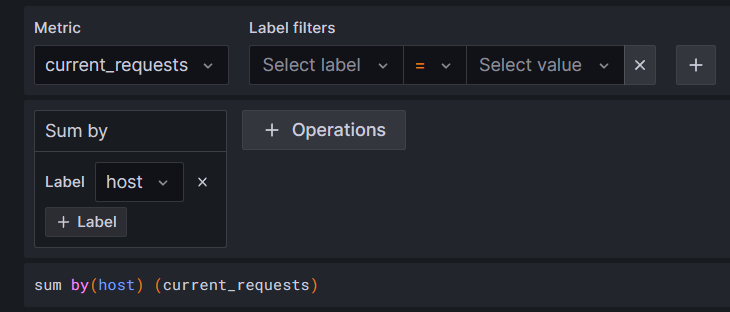
The graphs in Grafana are usually partitioned based on each unique combination of dimensions. The dimensions can be used in the Grafana queries to filter or aggregate the data. For example, if you graph current_requests, you'll see values partitioned based on each combination of dimensions. To filter based only on the host, add an operation of Sum and use host as the label value.
9. Distributed tracing with Jaeger
In step 6, you saw that distributed tracing information was being exposed to the console. This information tracks units of work with activities. Some activities are created automatically by the platform, such as the one by ASP.NET to represent the handling of a request, and libraries and app code can also create activities. The greetings example has a Greeter activity. The activities are correlated using the TraceId, SpanId, and ParentId tags.
Each process in a distributed system produces its own stream of activity information, and like metrics, you need a system to collect, store, and correlate the activities to be able to visualize the work done for each transaction. Jaeger is an open-source project to enable this collection and visualization.
Download the latest binary distribution archive of Jaeger for your platform from https://www.jaegertracing.io/download/.
Then, extract the download to a local location that's easy to access. Run the jaeger-all-in-one(.exe) executable:
./jaeger-all-in-one --collector.otlp.enabled
Look through the console output to find the port where it's listening for OTLP traffic via gRPC. For example:
{"level":"info","ts":1686963686.3854616,"caller":"otlpreceiver@v0.78.2/otlp.go:83","msg":"Starting GRPC server","endpoint":"0.0.0.0:4317"}
This output tells you it's listening on 0.0.0.0:4317, so you can configure that port as the destination for your OTLP exporter.
Open the AppSettings.json file for our project, and add the following line, changing the port if applicable.
"OTLP_ENDPOINT_URL" : "http://localhost:4317/"
Restart the greeter process so that it can pick up the property change and start directing tracing information to Jaeger.
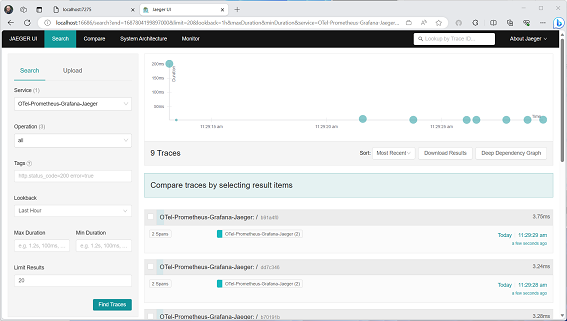
Now, you should be able to see the Jaeger UI at http://localhost:16686/ from a web browser.
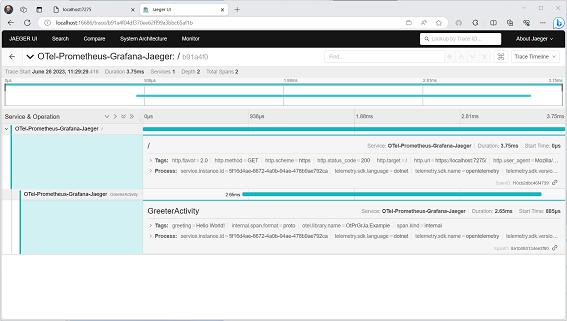
To see a list of traces, select OTel-Prometheus-grafana-Jaeger from the Service dropdown. Selecting a trace should show a gant chart of the activities as part of that trace. Clicking on each of the operations shows more details about the activity.
In a distributed system, you want to send traces from all processes to the same Jaeger installation so that it can correlate the transactions across the system.
You can make your app a little more interesting by having it make HTTP calls to itself.
Add an
HttpClientfactory to the applicationbuilder.Services.AddHttpClient();Add a new endpoint for making nested greeting calls
app.MapGet("/NestedGreeting", SendNestedGreeting);Implement the endpoint so that it makes HTTP calls that can also be traced. In this case, it calls back to itself in an artificial loop (really only applicable to demo scenarios).
async Task SendNestedGreeting(int nestlevel, ILogger<Program> logger, HttpContext context, IHttpClientFactory clientFactory)
{
    // Create a new Activity scoped to the method
    using var activity = greeterActivitySource.StartActivity("GreeterActivity");

    if (nestlevel <= 5)
    {
        // Log a message
        logger.LogInformation("Sending greeting, level {nestlevel}", nestlevel);

        // Increment the custom counter
        countGreetings.Add(1);

        // Add a tag to the Activity
        activity?.SetTag("nest-level", nestlevel);

        await context.Response.WriteAsync($"Nested Greeting, level: {nestlevel}\r\n");

        if (nestlevel > 0)
        {
            var request = context.Request;
            var url = new Uri($"{request.Scheme}://{request.Host}{request.Path}?nestlevel={nestlevel - 1}");

            // Makes an http call passing the activity information as http headers
            var nestedResult = await clientFactory.CreateClient().GetStringAsync(url);
            await context.Response.WriteAsync(nestedResult);
        }
    }
    else
    {
        // Log a message
        logger.LogError("Greeting nest level {nestlevel} too high", nestlevel);
        await context.Response.WriteAsync("Nest level too high, max is 5");
    }
}
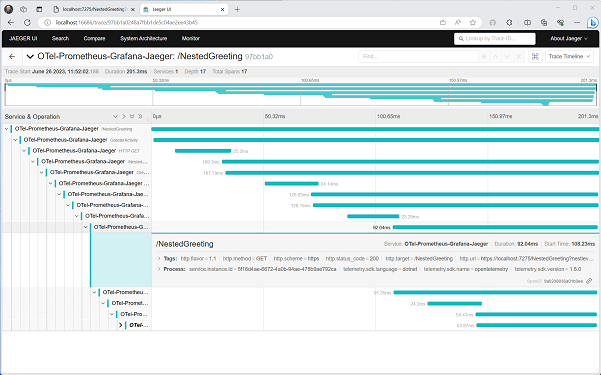
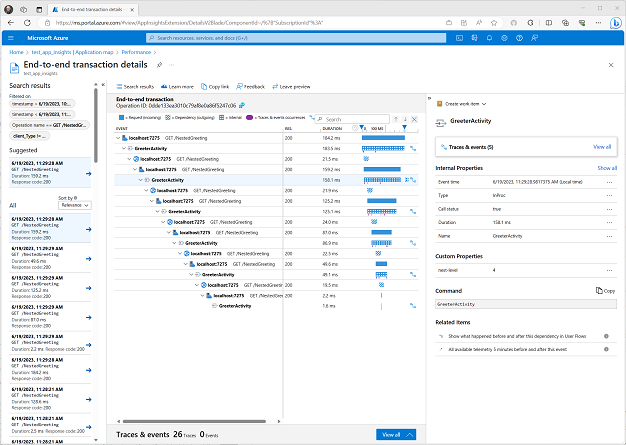
This results in a more interesting graph with a pyramid shape for the requests, as each level waits for the response from the previous call.
Example: Use Azure Monitor and Application Insights
In the previous example, you used separate open-source applications for metrics and tracing. There are many commercial APM systems available to choose from. In Azure, the primary application-monitoring product is Application Insights, which is part of Azure Monitor.
One of the advantages of an integrated APM product is that it can correlate the different observability data sources. To make the ASP.NET experience with Azure Monitor easier, a wrapper package is provided that does most of the heavy lifting of configuring OpenTelemetry.
Take the same project from Step 5 and replace the NuGet references with a single package:
<ItemGroup>
  <PackageReference Include="Azure.Monitor.OpenTelemetry.AspNetCore" Version="1.0.0-beta.4" />
</ItemGroup>
Then, replace the OTel initialization code with:
var otel = builder.Services.AddOpenTelemetry();
otel.UseAzureMonitor();
otel.WithMetrics(metrics => metrics
    .AddMeter(greeterMeter.Name)
    .AddMeter("Microsoft.AspNetCore.Hosting")
    .AddMeter("Microsoft.AspNetCore.Server.Kestrel"));
otel.WithTracing(tracing =>
{
    tracing.AddSource(greeterActivitySource.Name);
});
UseAzureMonitor() is the magic that will add the common instrumentation libraries and exporters for Application Insights. You just need to add your custom Meter and ActivitySource names to the registration.
If you're not already an Azure customer, you can create a free account at https://azure.microsoft.com/free/. Log in to the Azure Portal, and either select an existing Application Insights resource or create a new one with https://ms.portal.azure.com/#create/Microsoft.AppInsights.
Application Insights identifies which instance to use to store and process data through an instrumentation key and connection string that are found at the top right side of the portal UI.
If you're using Azure App Service, this connection string is automatically passed to the application as an environment variable. For other services or when running locally, you need to pass it using the APPLICATIONINSIGHTS_CONNECTION_STRING environment variable or in appsettings.json. For running locally, it's easiest to add the value to appsettings.json:
"AzureMonitor": {
    "ConnectionString": "InstrumentationKey=12345678-abcd-abcd-abcd-12345678..."
}
Note
Replace the value with the one from your instance.
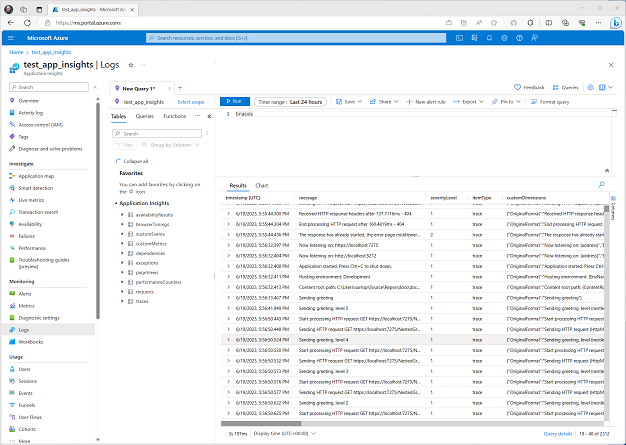
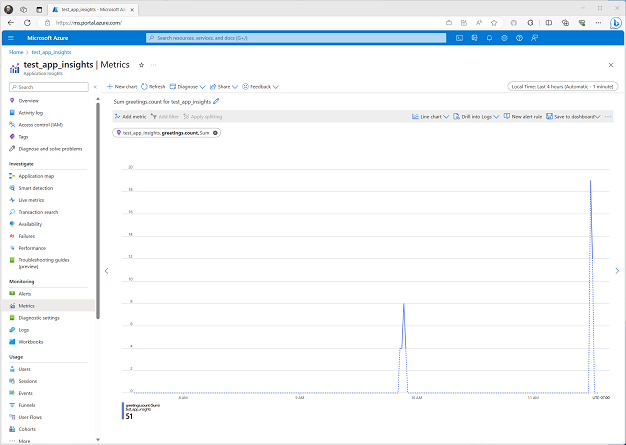
When you run the application, telemetry will be sent to Application Insights. You should now get logs, metrics, and distributed traces for your application.
Feedback
Coming soon: Throughout 2024 we will be phasing out GitHub Issues as the feedback mechanism for content and replacing it with a new feedback system. For more information see: https://aka.ms/ContentUserFeedback.
Submit and view feedback for

