Queue dashboard
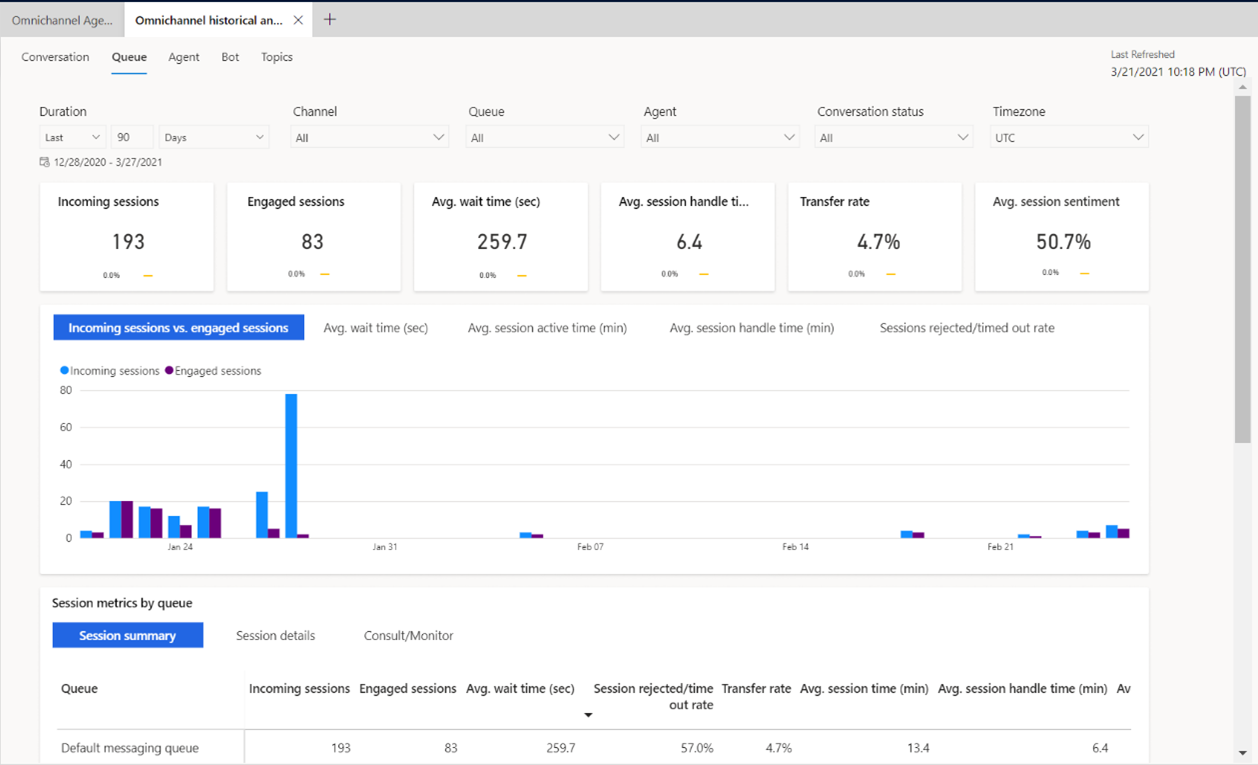
The Queue dashboard gives you a broad overview of the customer service experience in your organization by providing insights into how specific queues are operating.

By default, the dashboard shows key performance indicators (KPIs) for the past month and for all channels, queues, and agents in your system. You can use the data filtering options to select data for specific time periods, channels, queues, agents, conversation status, and time zone. To filter data by duration, channel, queue, agent, conversation status, or time zone, select a value from the respective dropdown list.
Note
If you switch to a different dashboard, the filter you specified will persist and be applied to the data on all dashboards.
Access the Queue dashboard
In the Customer Service workspace or Omnichannel for Customer Service app, do one of the following to view the dashboard:
- In the default view, select the plus (+) icon, and then select Omnichannel historical analytics.
- If the enhanced multisession workspace view is enabled, select the site map and then select Omnichannel historical analytics.
On the page that appears, select the dashboard.
Report details
The following KPIs are displayed in the Queue dashboard.

| KPI | Description |
|---|---|
| Incoming sessions | The total number of sessions initiated by customers. |
| Engaged sessions | The number of sessions presented to an agent that were accepted. |
| Avg. wait time (sec) | The average time customers waited before connecting to an agent. It's similar to "speed to answer," but this metric includes the wait time from each session within a conversation. |
| Avg. session handle time | The total session active time across engaged sessions. |
| Transfer rate | The percentage of conversations that were transferred to another agent or queue. |
| Avg. session sentiment | The average predicted customer sentiment for a given session. |
The following charts are displayed in the Queue dashboard.

| Title | Description |
|---|---|
| Incoming session vs engaged session | The total number of sessions initiated by customers versus the number of sessions initiated and accepted by an agent. |
| Avg. wait time (sec) | The average time customers waited before connecting to an agent. It's similar to "speed to answer," but this metric includes wait time from each session within a conversation. |
| Avg. session active time (min) | The average total session active time across engaged conversations. |
| Avg. session handle time (min) | The average total session handle time across engaged conversations. |
| Sessions rejected/timed out rate | The number of sessions presented to an agent that weren't accepted. |

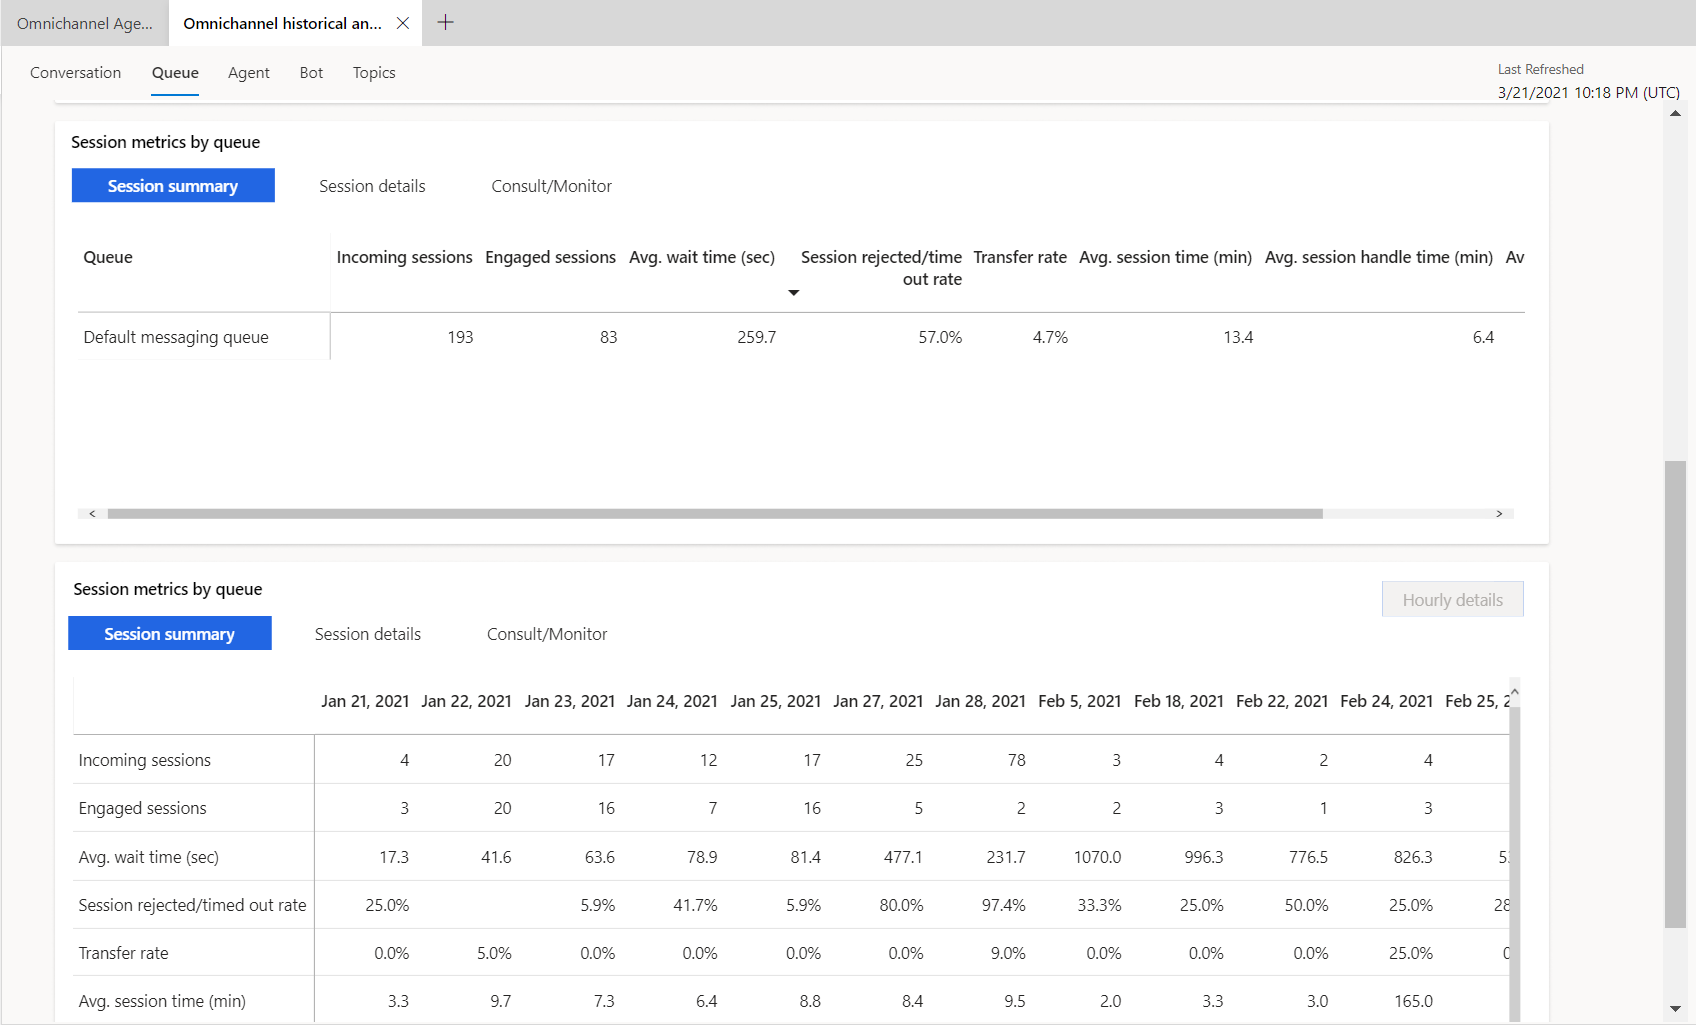
| Session summary | Description |
|---|---|
| Incoming sessions | The number of sessions initiated by a customer |
| Engaged sessions | The number of sessions accepted by an agent. |
| Avg. wait time (sec) | The average time customers waited before connecting to agents. This is similar to "speed to answer," but it includes wait time from each session within a conversation. |
| Session rejected/timed out rate | The number of sessions presented to an agent that weren't accepted. |
| Transfer rate | The percentage of conversations that were transferred to another agent or queue. |
| Avg. session time (min) | The average time, from session start to end, for engaged sessions. |
| Avg. session handle time (min) | The average of the total session active time across engaged sessions. |
| Avg. session sentiment | The average predicted customer sentiment for a given session. |
| Session details | Description |
|---|---|
| Avg. session active time (min) | The average total session active time across engaged conversations. |
| Avg. session inactive time (min) | The average total session inactive time across engaged sessions. |
| Avg. incoming messages | The average total number of incoming messages from the customer, per session. |
| Avg. outgoing messages | The average total number of outgoing messages from the customer, per session. |
| Incoming messages | The total incoming messages from the customer, per session. |
| Outgoing messages | The total outgoing messages per session from customer, per session. |
| Consult/ Monitor | Descriptions |
|---|---|
| Consult sessions | Number of sessions where the agent has participated in consult mode. |
| Avg consult time (min) | Average time an agent spent during a session in consult mode. |
| Monitor sessions | Number of sessions where the agent has participated in monitor mode |
| Avg monitor time (min) | Average time agent spent on a session in monitoring mode |
A blue upward triangle next to the value indicates that the percentage has changed in a positive direction. A red downward triangle indicates that the percentage has changed in a negative direction.
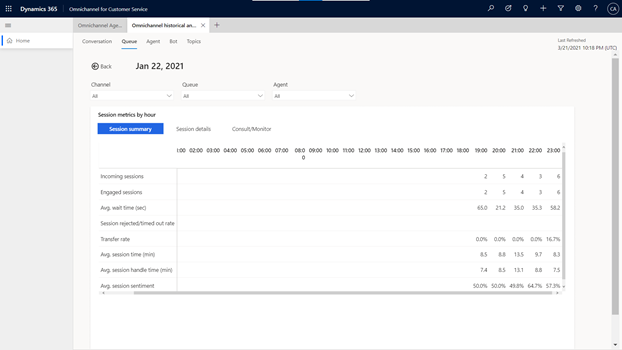
Queue hourly details drill-down view
The "queue hourly details drill-down" view provides a more granular insight into the hour-by-hour breakdown of key conversation metrics within the contact center. Metrics for the conversation summary and conversation details are the same as the day-by-day view, ensuring that supervisors can consistently analyze their contact center operation regardless of duration granularity.
To view the drill-down report, select any single metric value on the required day, then select Hourly details.

See also
Conversation dashboard
Dashboard overview
Agent dashboard
Bot dashboard
Conversation Topics dashboard
Manage report bookmarks
Feedback
Coming soon: Throughout 2024 we will be phasing out GitHub Issues as the feedback mechanism for content and replacing it with a new feedback system. For more information see: https://aka.ms/ContentUserFeedback.
Submit and view feedback for