 Visual Studio 2022 version 17.10 Release Notes
Tip
Watch the recordings of the Visual Studio 2022 launch event to learn about what's new, hear tips & tricks, and download free digital swag.
Developer Community | Visual Studio 2022 Roadmap | System Requirements | Compatibility | Distributable Code | Release History | License Terms | Blogs | Latest Release Known Issues | Whats New in Visual Studio Docs
Click a button to download the latest version of Visual Studio 2022. For instructions on installing and updating Visual Studio 2022, see Update Visual Studio 2022 to the most recent release. Also, see instructions on how to install offline.
Visit the Visual Studio site to download other Visual Studio 2022 products.
Visual Studio 2022 version 17.10 Releases
- June 18th 2024 — Visual Studio 2022 version 17.10.3
- June 11th 2024 — Visual Studio 2022 version 17.10.2
- May 29th 2024 — Visual Studio 2022 version 17.10.1
- May 21st 2024 — Visual Studio 2022 version 17.10.0
Visual Studio 2022 Blog
The Visual Studio 2022 Blog is the official source of product insight from the Visual Studio Engineering Team. You can find in-depth information about the Visual Studio 2022 releases in the following posts:
 Visual Studio 2022 version 17.10.3
released June 18th, 2024
Summary of What's New in this Release
- Visual Studio will no longer crash after executing the C# Interactive command from the MenuController on the Standard ToolBar.
- The use of @ inside a tag helper in a razor file could lead to incorrect compilation errors. https://github.com/dotnet/razor/issues/10186
Developer Community
- Extension does not work anymore after upgrade to 17.10.2, Extensibility.Contracts is missing
- vs 2022 typescript intellisense not working in 17.10.1
- Copying in debug Text Visualizer is broken
- TAB key does not reliably accept grey text suggestion in Markdown for Copilot Completions in Visual Studio 17.8.6
- C# Interactive menu is missing in Tool Bar | Other Windows
 Visual Studio 2022 version 17.10.2
released June 11th, 2024
Summary of What's New in this Release
- Fixed an issue in which TypeScript errors might be shown in a Razor file when there are no errors in TypeScript for the file.
- After upgrading to Germanium build of Windows, WSL requires a manual upgrade. This can cause Visual Studio to hang when opening CMake projects.
- VS now includes MAUI 8.0.40 (SR5)
- Add an optional installer component for the recently released Windows SDK version 10.0.26100.
- The use of .NET SDK 7 caused issues when combined with Razor projects. https://github.com/dotnet/razor/issues/10411. Note: the .NET SDK 7 series is out of support. Customers previously hitting this should strongly consider moving to a .NET SDK which is in support.
Developer Community
- TS1109 (TS) Expression expected error in Razor file
- cmdnameRunIntellisenseCheck leftover in Tools
- Cannot nuget restore after updating visual studio community to 17.10.0. An item with the same key has already been added.
- Unable to debug x86 code on Sapphire Rapids CPUs in Visual Studio 2022
Security advisories addressed
- CVE-2024-30052 Remote Code Execution when debugging dump files that contain a malicious file with an appropriate extension
- CVE-2024-29060 Elevation of Privilege where affected installation of Visual Studio is running
- CVE-2024-29187 WiX based installers are vulnerable to binary hijack when run as SYSTEM
 Visual Studio 2022 version 17.10.1
released May 29th, 2024
Summary of What's New in this Release
Developer Community
- Visual Studio in a startup loop because of outdated GitHub Copilot Extension after upgrade
- Could not find SDK "Microsoft.VCLibs.Desktop, Version=14.0"
- VS 17.10.0 Preview 3.0 and MFC user dll + CLR -> linker error
- Unexpected vblendps in place of vinsertps when using toolchain 14.39.33523
- cl.exe crashed when building the latest clang for x64
- VS2022 17.10.0 Preview 4 test controller or agent error: Padding is invalid and cannot be removed
 Visual Studio 2022 version 17.10.0
released May 21st, 2024
Summary of What's New in this Release
GitHub Copilot in Visual Studio
GitHub Copilot: Your AI-powered coding companion is seamlessly woven into your Visual Studio IDE, enhancing your everyday tasks and bringing you the latest AI-driven coding experiences. Copilot is designed to elevate your efficiency by offering:
- Personalized code suggestions
- Crafting git commit messages
- Answering coding-related queries
We introduced the new, unified Copilot experience in Visual Studio 17.10. This combines the features of Copilot and Copilot Chat into one convenient package, eliminating the need to install two separate extensions. Enjoy more deeply integrated AI experiences! Activate your GitHub Copilot subscription today by signing in to GitHub or starting a free trial for the latest AI experience.
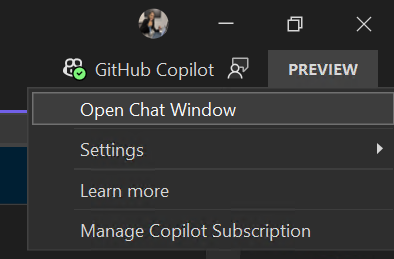
Note: Copilot is now located in the top right corner of your Visual Studio interface.
Improve Your Code Reviews with Generated Pull Request Descriptions
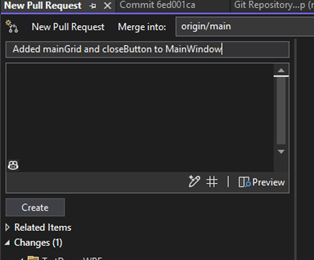
Similar to our generated Git commit message feature, you can now get a first draft for your pull request description created by GitHub Copilot. You'll get assistance in providing important context to your colleagues for their reviews and double check you're including the right changes in your pull request.
You'll need to verify you have an active GitHub Copilot subscription and the GitHub Copilot Chat Extension installed. Try it out by clicking the 'Add AI Generated Pull Request Description' sparkle pen icon within the Create a Pull Request window. Please share your feedback on this feature here.
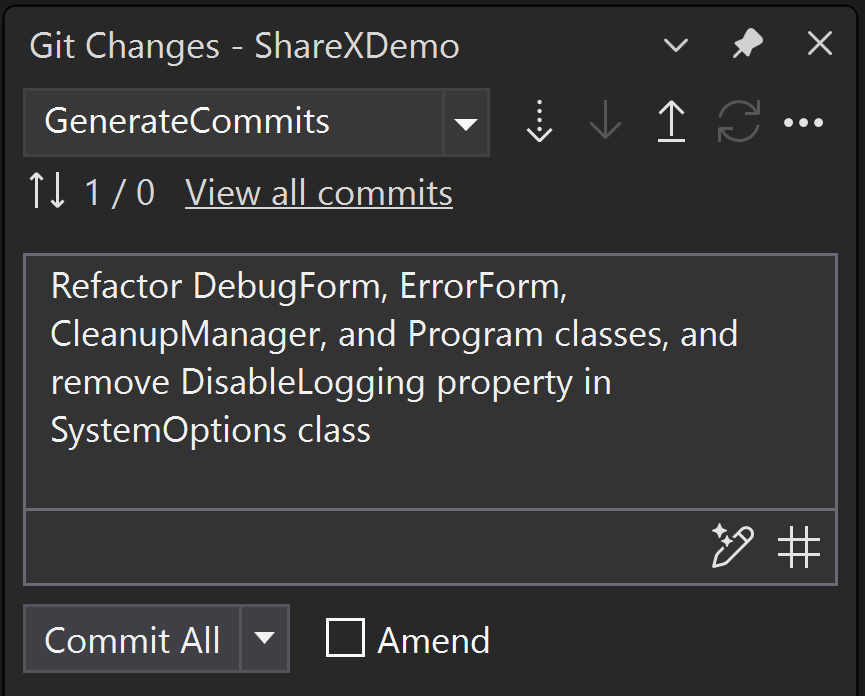
We listened to your feedback and are shortening the output of our generated Git Commit features. Share feedback on this change on the ticket in Developer Community.
Unravel Your Commit History with GitHub Copilot
Git history can be daunting to shuffle through, but it's often the best way to learn about a code base or help identify the origin of a bug. We've added a GitHub Copilot powered explain feature to the Commit Details window to make it easier to understand the contents of each commit.
You'll need to have an active GitHub Copilot subscription and the GitHub Copilot Chat Extension installed. Double click on any commit to open the Commit Details pane in the Git Repository window. Then, click on the 'Explain Commit' sparkle pen icon to get a summary of the changes side by side with the code. We plan to continue improving this feature so share your feedback here.

Build cloud native apps with .NET Aspire
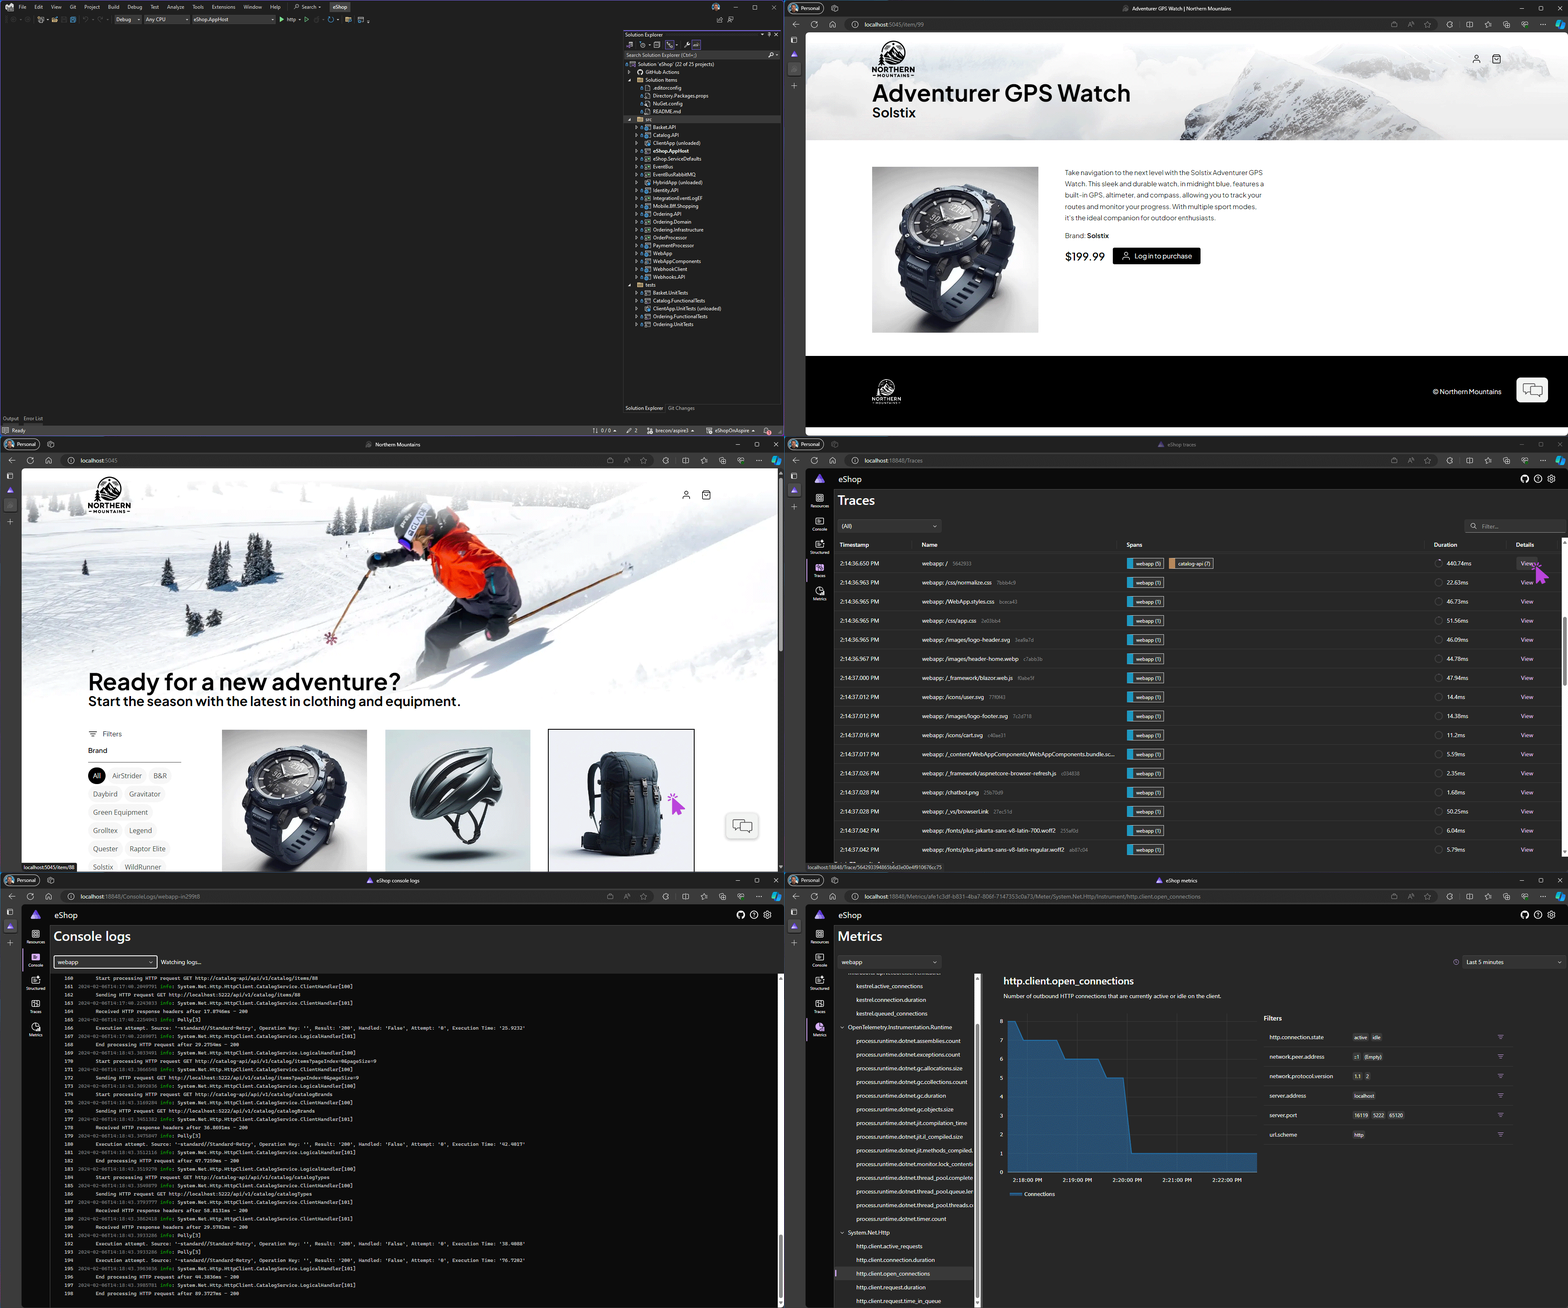
.NET Aspire is an opinionated, cloud ready stack for building observable, production ready, distributed applications. .NET Aspire is delivered through a collection of NuGet packages that handle specific cloud-native concerns. Whether you're building distributed, cloud-native applications using containerized resources like PostgreSQL and Redis, or Azure components like Storage or Service Bus, .NET Aspire will simplify your development experience and give you more visibility across your distributed apps with features like:
- Multi-project startup and debug without needing to configure your solution
- Built-in support for HTTP resiliency, health checks, and OpenTelemetry using a set of opinionated extensions and defaults
- Convenient in-browser views of logs, metrics, and distributed traces of your containerized resources and .NET projects with the new .NET Aspire Dashboard launch experience
- A new deployment methodology built atop the Azure Developer CLI (AZD), so you'll have multi-node deployment capability in most cases, without needing to write your own infrastructure code
Debugging and Diagnostics
Copilot Generated Breakpoint Conditions
Boost your debugging speed with AI-generated suggestions for conditional breakpoints and tracepoints. Copilot analyzes your code to propose smart expressions tailored to your breakpoints, making debugging smoother.
When you're setting up a conditional breakpoint or tracepoint and hover over the condition area in the settings window, Copilot quickly presents AI-generated expression ideas based on your code. Choose the condition that suits your needs best and place your breakpoint or tracepoint with ease.

.NET Counter profiler visualization with new UpDown and ObservableCounter instruments
The .NET counter profiler in Visual Studio now introduces support for two innovative metrics: UpDown, enabling real-time tracking of values with both incremental and decremental changes, and ObservableCounter, which autonomously manages aggregated totals, offering customizable callback delegates for precise control. In the provided screenshot, "total-hats" illustrates an UpDown counter, while "orders-pending" demonstrates an ObservableCounter.
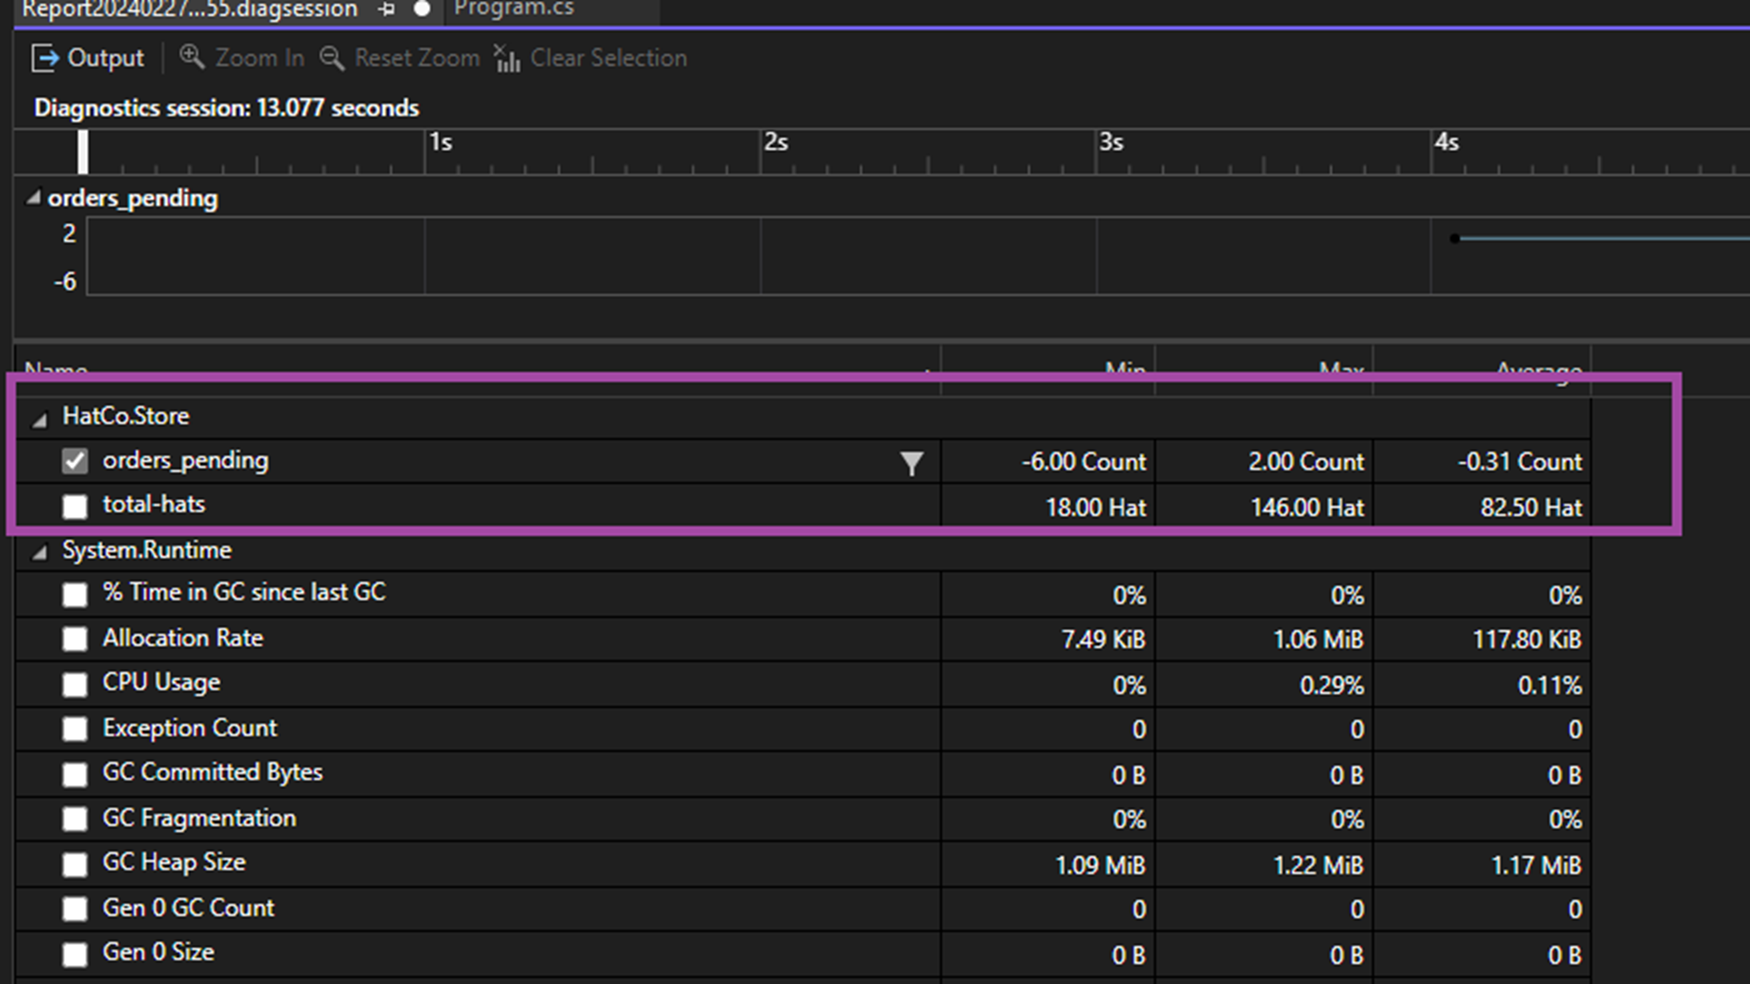
Moreover, we've implemented a filter flyout feature, enabling you to conveniently filter data points based on tags. This dynamically adjusts both summary and swimlane views according to the applied combinations.
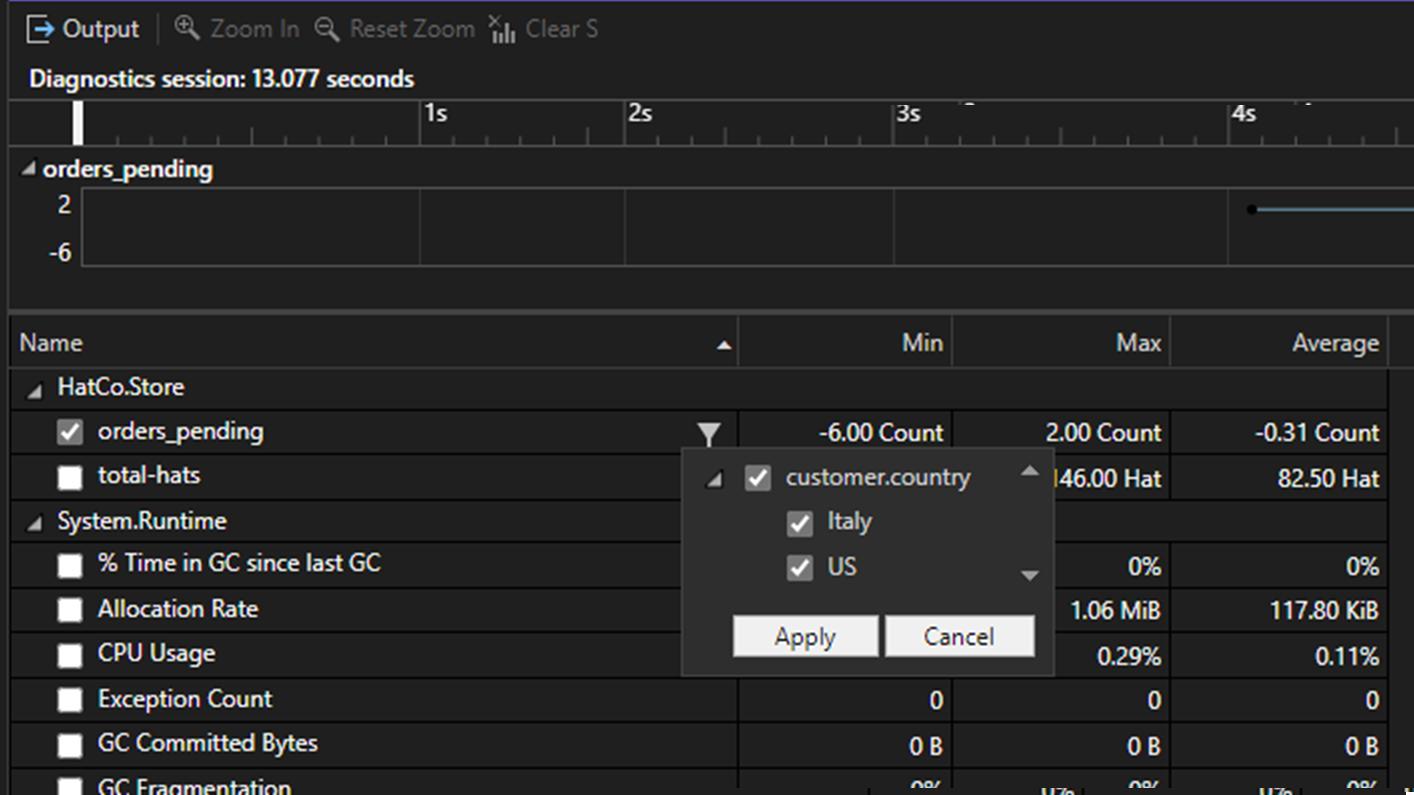
This enhancement significantly enhances flexibility, streamlining the monitoring of dynamic values in projects. For instance, in web application development, the UpDown counter can monitor user interactions such as page views, while the Observable Counter optimizes server resources by efficiently managing active session totals.
GC Insights in Managed Memory Window
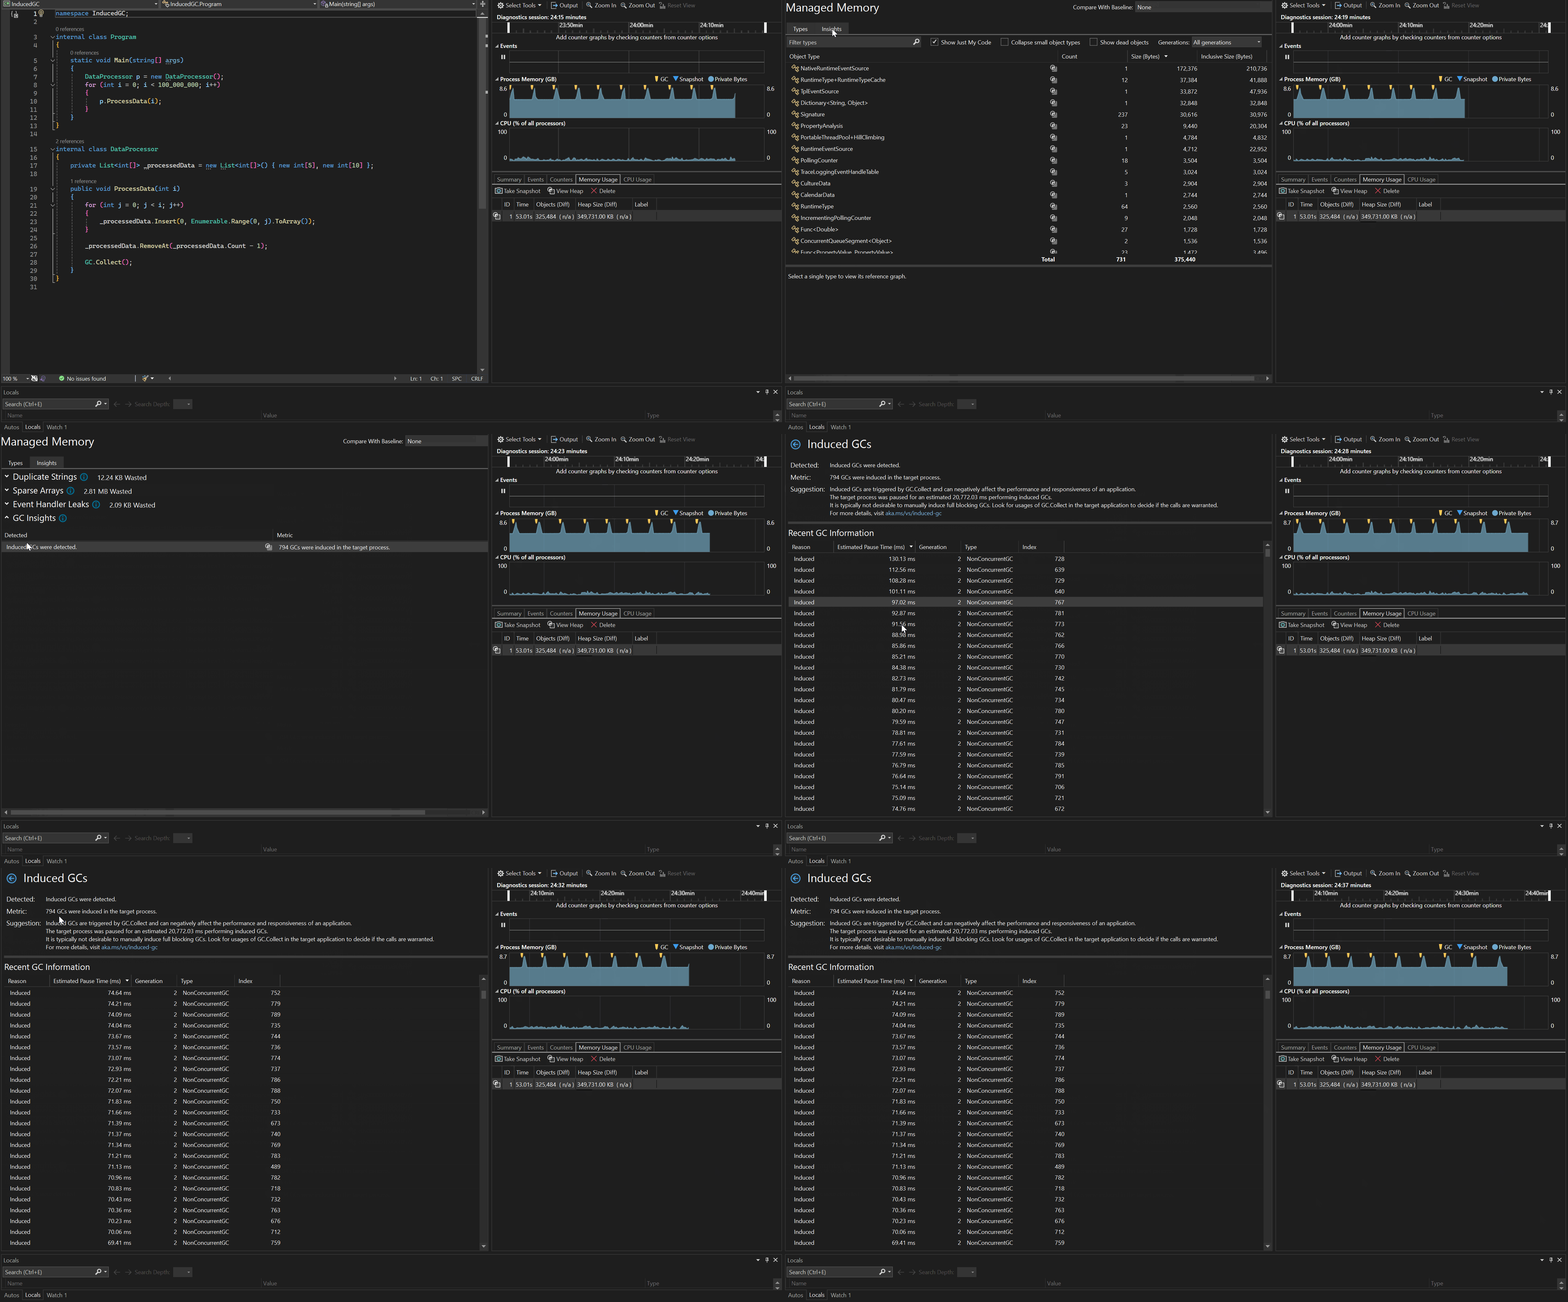
The managed memory window Insights tab now supports GC Insights. This feature provides a deeper understanding of your application's performance by shedding light on instances of induced Garbage Collection (GC). These instances are generally considered undesirable as they can impede the efficiency of your processes, since they involve manual intervention rather than allowing the Garbage Collector to autonomously manage memory allocation. Furthermore, GC Insights offers the ability to analyze these occurrences with time estimates, allowing you to better comprehend the impact of induced GC on their application's execution timeline.
Creating Conditional Breakpoints and Tracepoints from Expressions
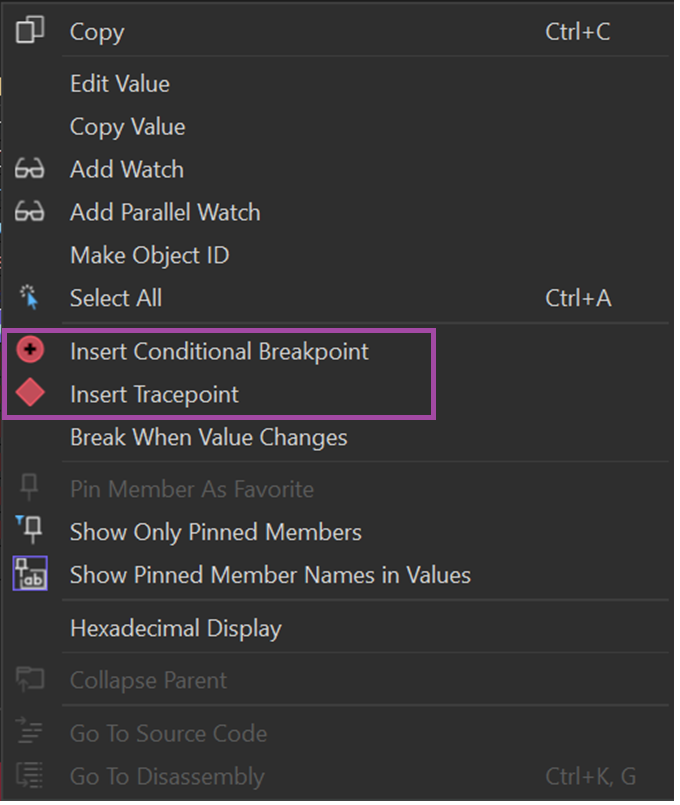
This upgrade simplifies debugging with new menu options: "Insert Conditional Breakpoint" and "Insert Tracepoint." You can now create breakpoints effortlessly using property or field names and values from autos, locals, watch windows, or DataTips. This makes debugging workflows easier, especially for complex expressions.
Simplifying memory usage investigations with the Memory Tool
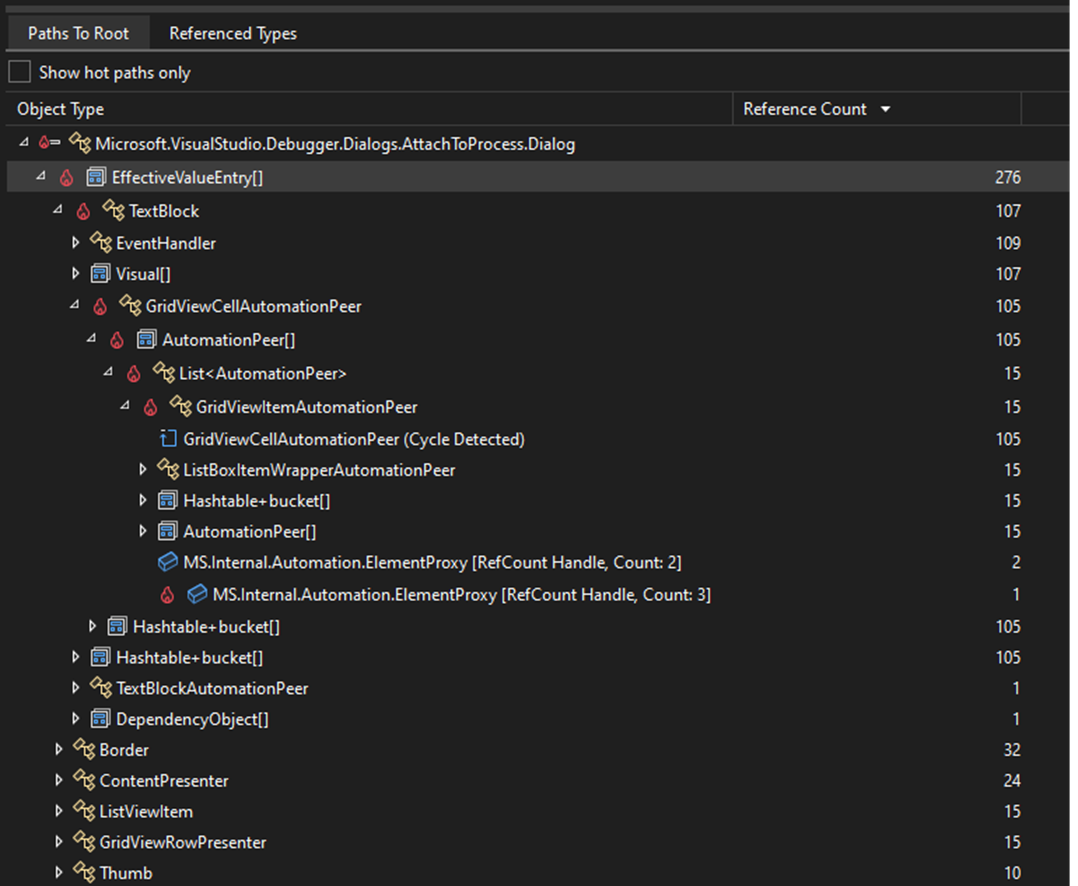
The new "Hot Path to Root" feature improves memory analysis by finding the most likely path to the root for calculating an object's total size. It transforms the heap graph into a tree, using shortcuts like prioritizing the shortest path and avoiding cycling paths to actual roots. This feature is a great starting point for memory investigations, known as the "Hot Path to Root" in the Memory Usage tool reference graph. You'll spot the hot path with a red icon in the tree below.
Attach to Process Dialog Revamp
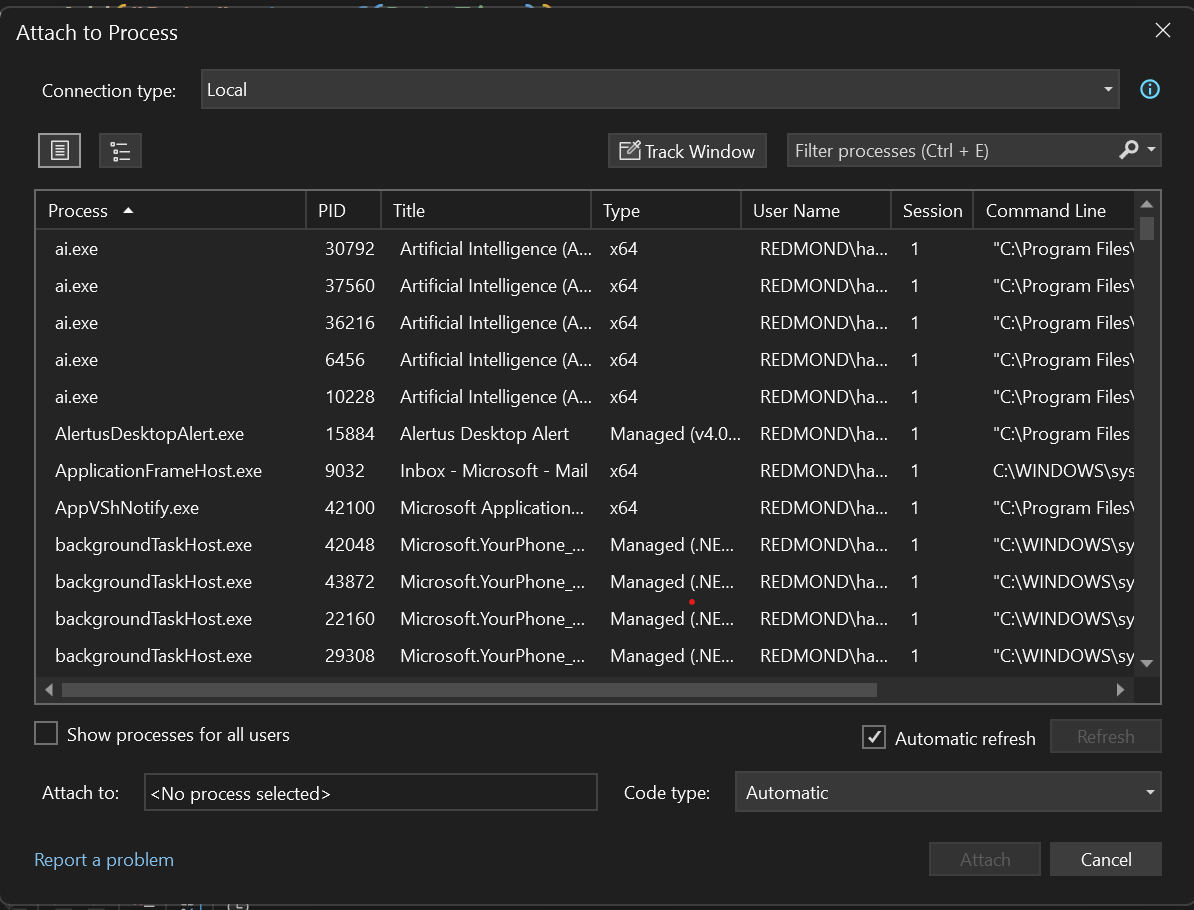
The Attach to Process dialog in Visual Studio has been greatly improved for better functionality and user-friendliness. These updates include seamless integration with Visual Studio themes, a more space-saving view with tooltips for connection info, and setting "Local" connection as the default for faster access. You can now easily switch between tree and list views, organize processes better with collapsible sections, and select code types with a simplified combobox. Moreover, the “Select/Track Window" feature is now easier to use, allowing two- way tracking, selecting a process highlights its window, and clicking on a window selects its process.
Targeted Instrumentation for EXE
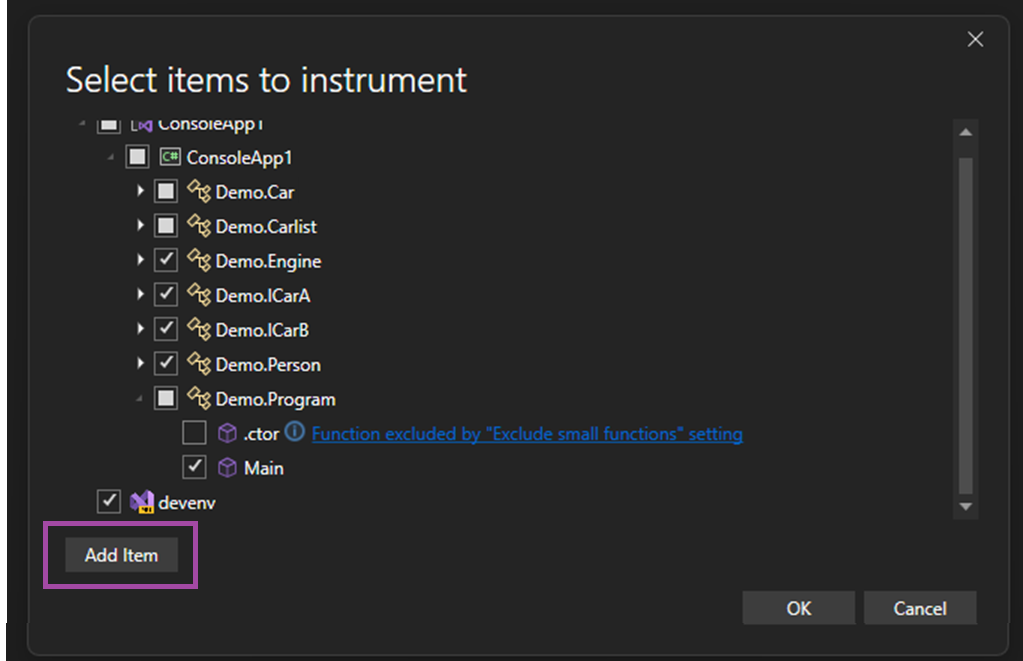
The Performance Profiler's Instrumentation Tool now allows targeted profiling for any executable (exe) file. After selecting an exe file, a targeted instrumentation dialog appears, similar to startup project profiling. This enhancement enables focused analysis of performance metrics for specific executables. Additionally, you can broaden the profiling scope by including extra Dynamic Link Libraries (DLLs) using the 'Add Item' button, enhancing the examination of application performance.
Blazor debugging performance for some projects
When building ASP.NET Core Blazor projects you may experience significant delays when you start debugging in some cases. With this release we have made changes which should prevent those delays. If you cannot upgrade to 17.10, or above, there is a workaround listed on Developer Community site for version 17.9.
Cancel Solution Load
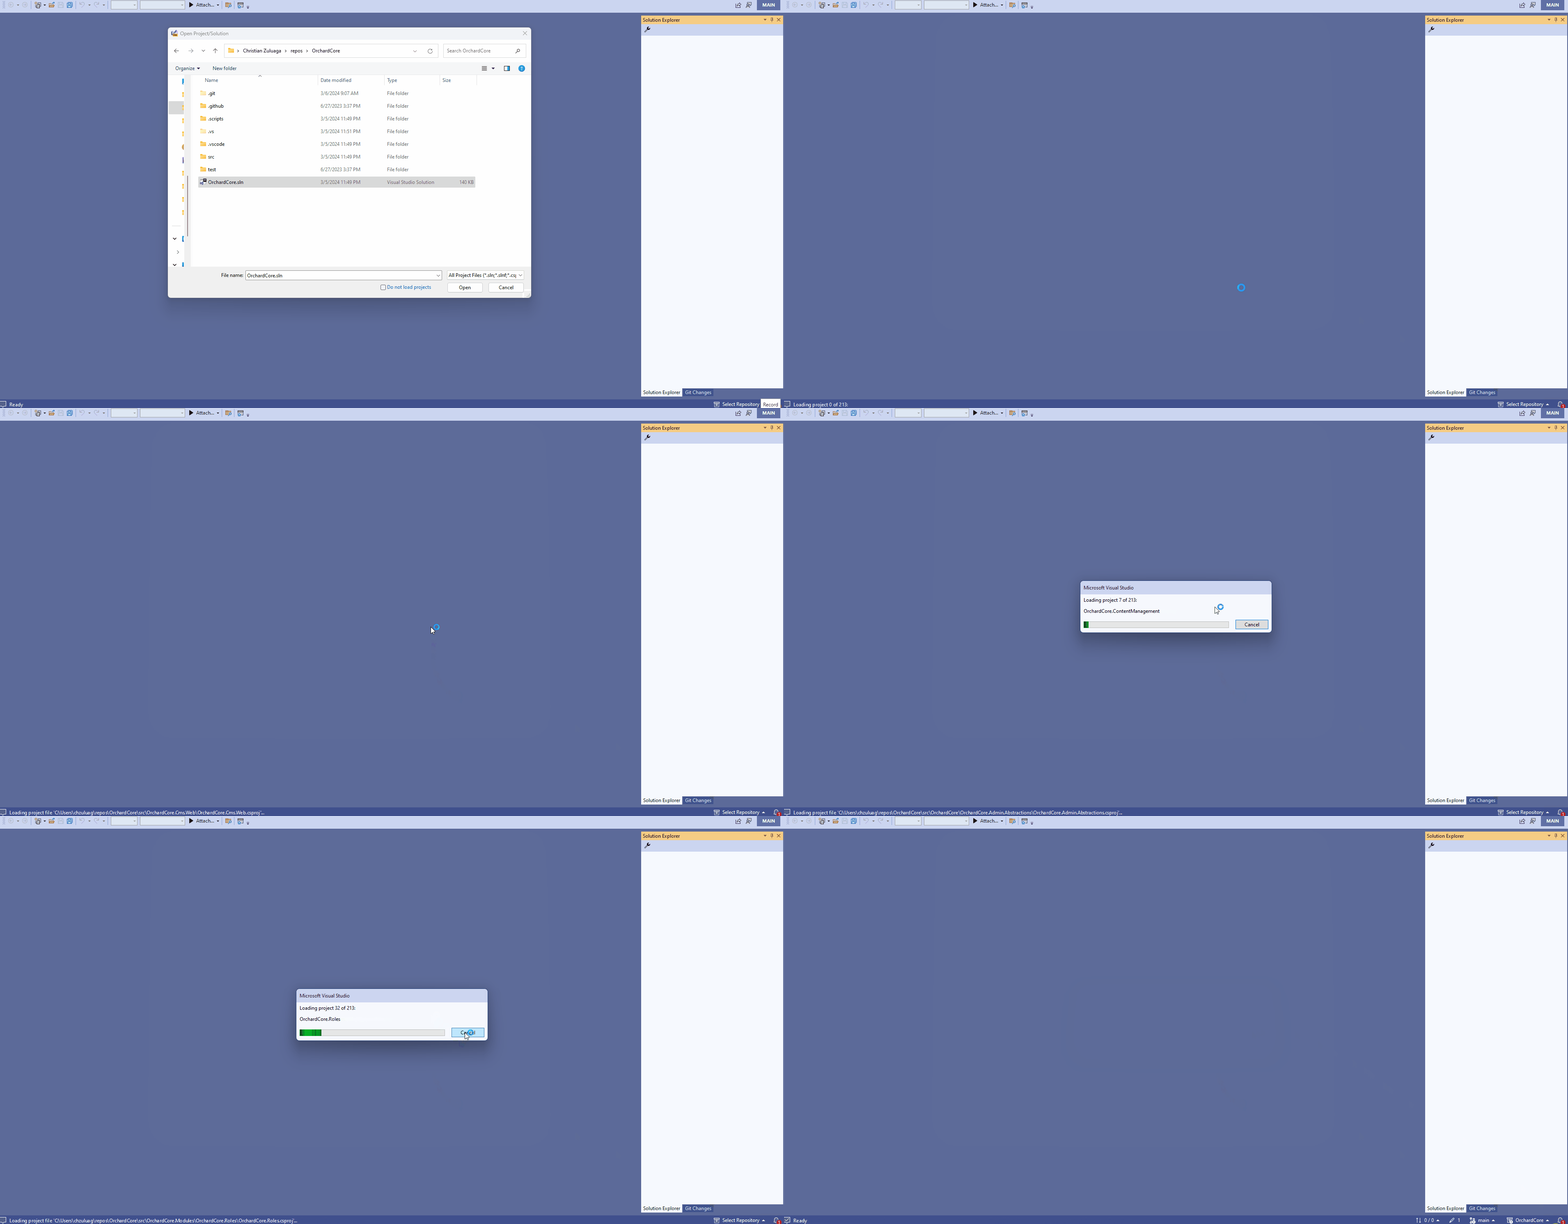
If you want to stop the solution load process before all the projects get loaded. You can now cancel the operation and return to an empty environment IDE.
Microsoft Teams development tools(Teams Toolkit)
Teams Toolkit now includes a new project file (.ttkproj) that is used to organize all of the files for managing a Teams app. Creating a new Microsoft Teams App project will create a solution with two projects and you'll see a TeamsApp project which contains the app manifest and other files for Teams Toolkit features along with another C# project with example code for implementating app capabilities like a conversational bot, Tab, etc.
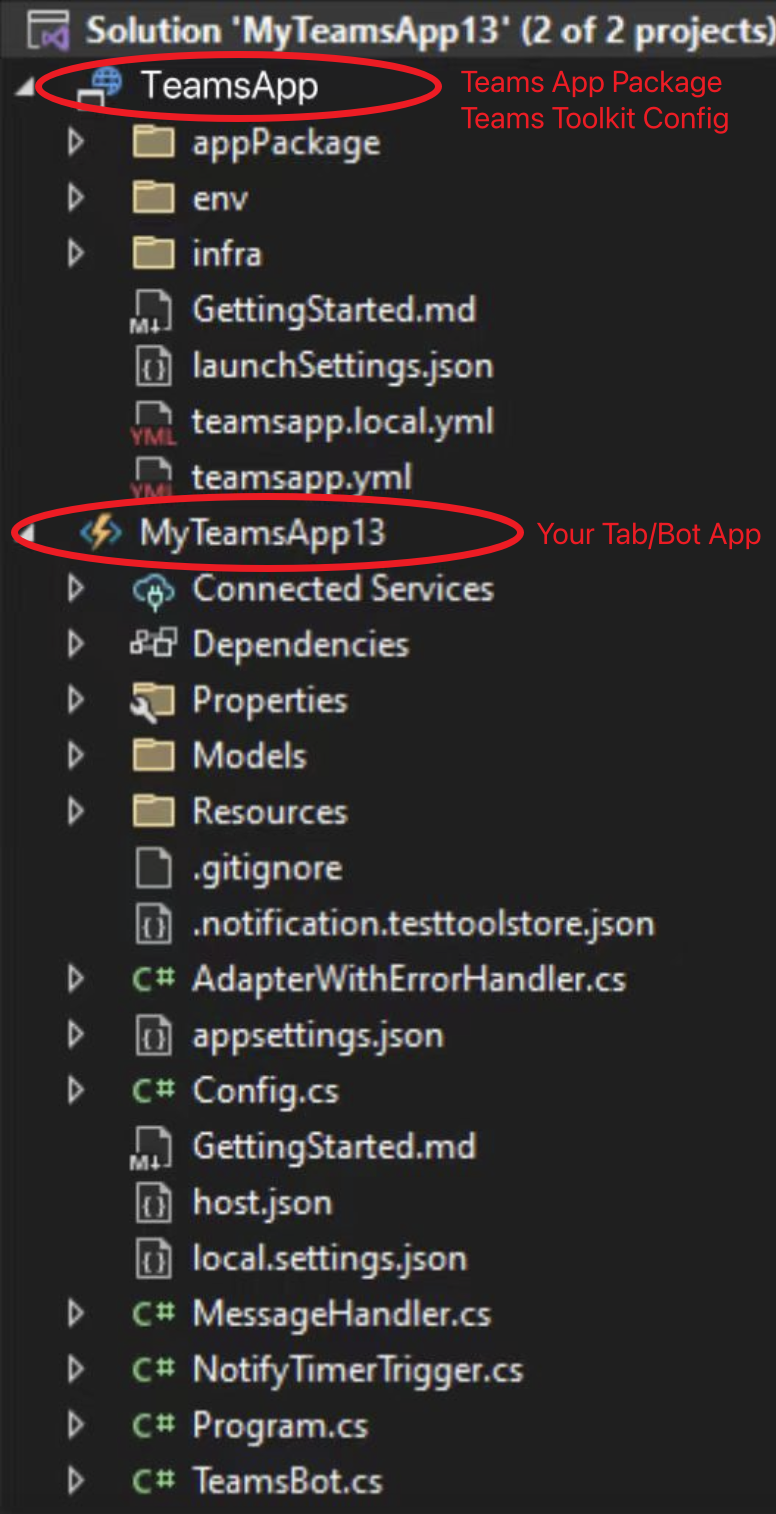
You'll also find these changes:
- The Teams Toolkit project menu is now discoverable on the TeamsApp project
- Support for the Preview Features > Enable Multi-Project Launch Profiles to make it simpler to Start Debugging in Teams, Outlook, or other supported platforms of your Teams app
New WinUI workload and template improvements
Getting started with WinUI has never been easier
The new Windows application development workload is now available for developers to jump right in and get started with writing stylish, modern, and fast WinUI apps using .NET. With one click, you’re ready to install.
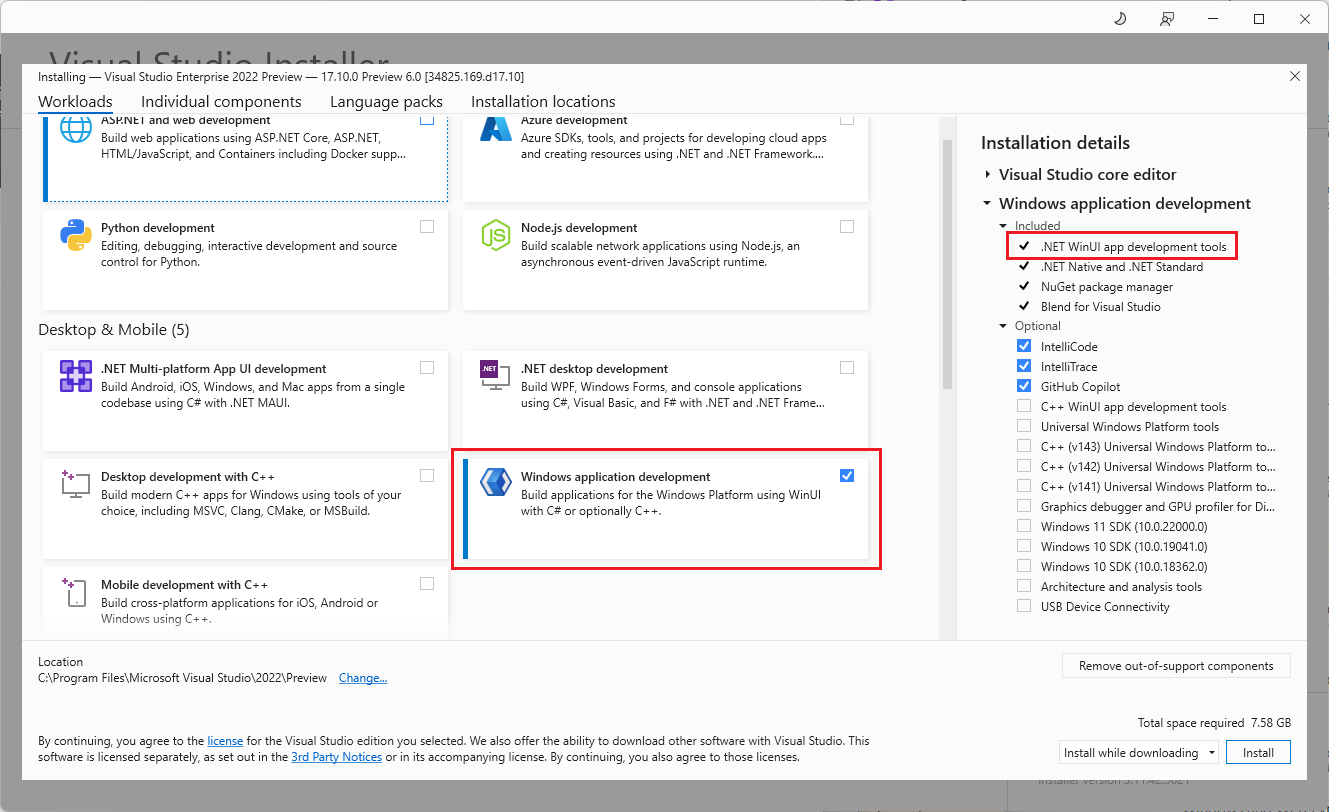
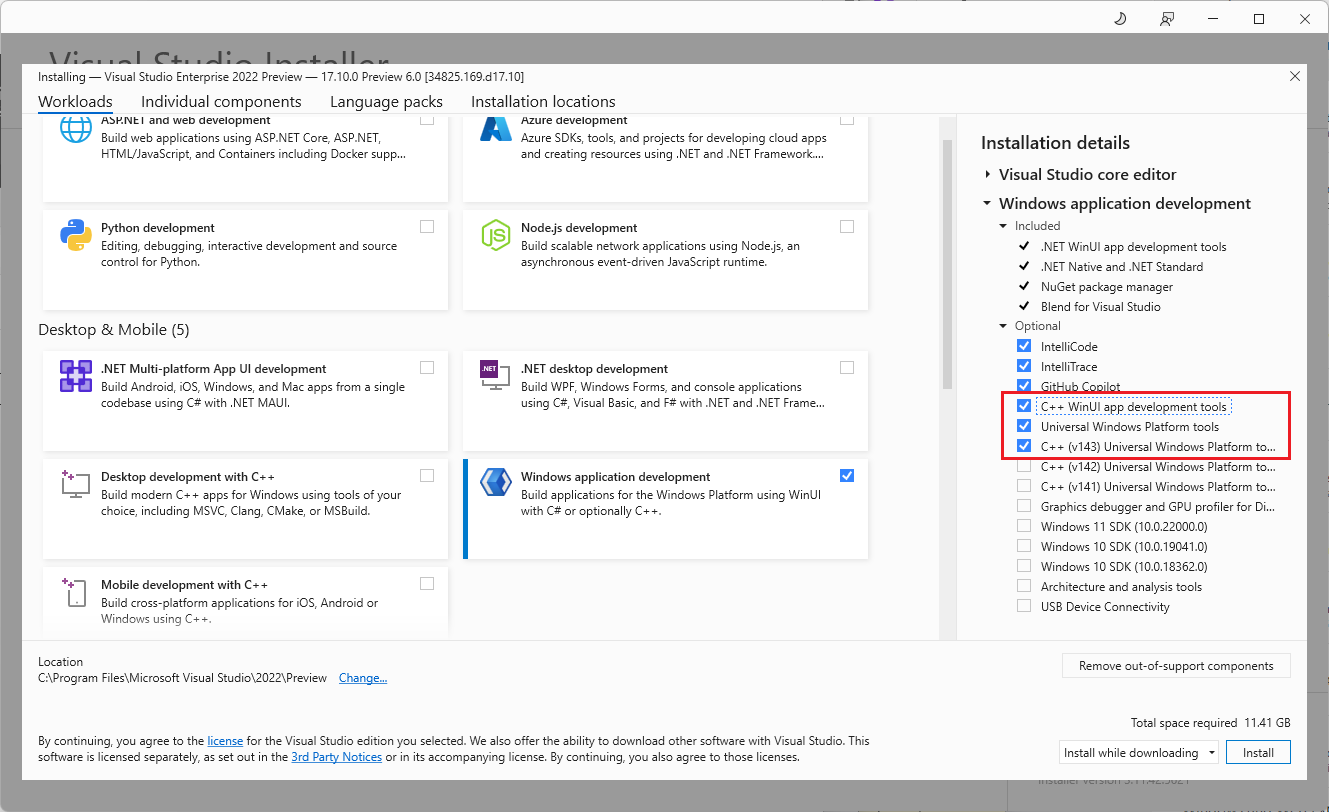
If you'd like to write your WinUI app in C++, you can select the optional component under this workload.
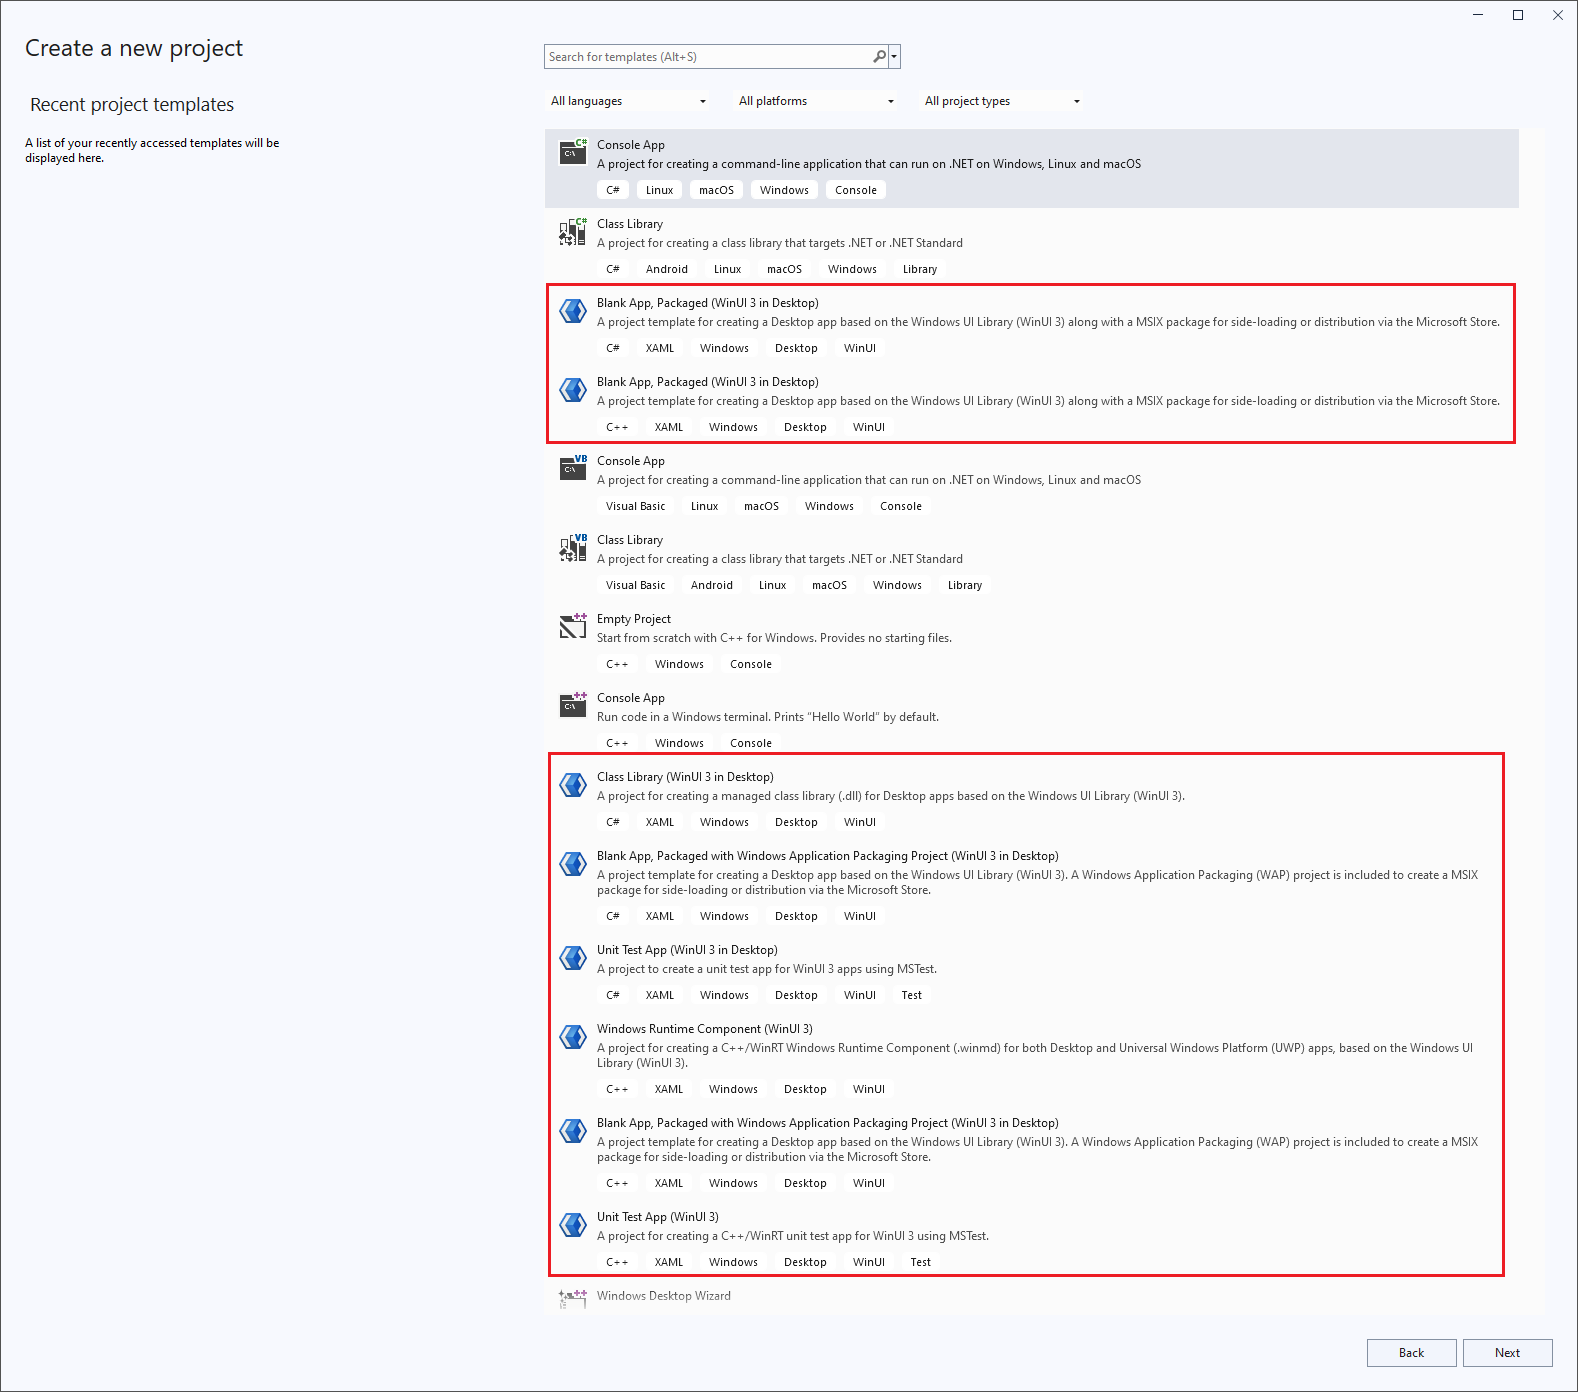
Dive into WinUI faster with better template selection and new Unit Test templates
WinUI templates have been given a fresh new icon and priority boost in the New Project template selection list, making them more accessible. The most popular blank app templates for both C# and C++ are near the top so you can hop into code without having to search or scroll. We’ve also added brand new community-requested Unit Test templates for WinUI to help you test your apps more easily!
Extensibility
You can now use the Visual Studio 2022 version 17.10 installer to export installed instance-wide Marketplace extensions into a *.vsconfig file. This new export feature complements the Visual Studio installer's ability to load extensions specified in a *.vsconfig file that we shipped in 17.9. If you have any feedback or suggestions about this experience, please let us know in our Developer Community.
Refer to the online documentation for more information about using *.vsconfig files.
Inlay Hints for C# code in Razor Files
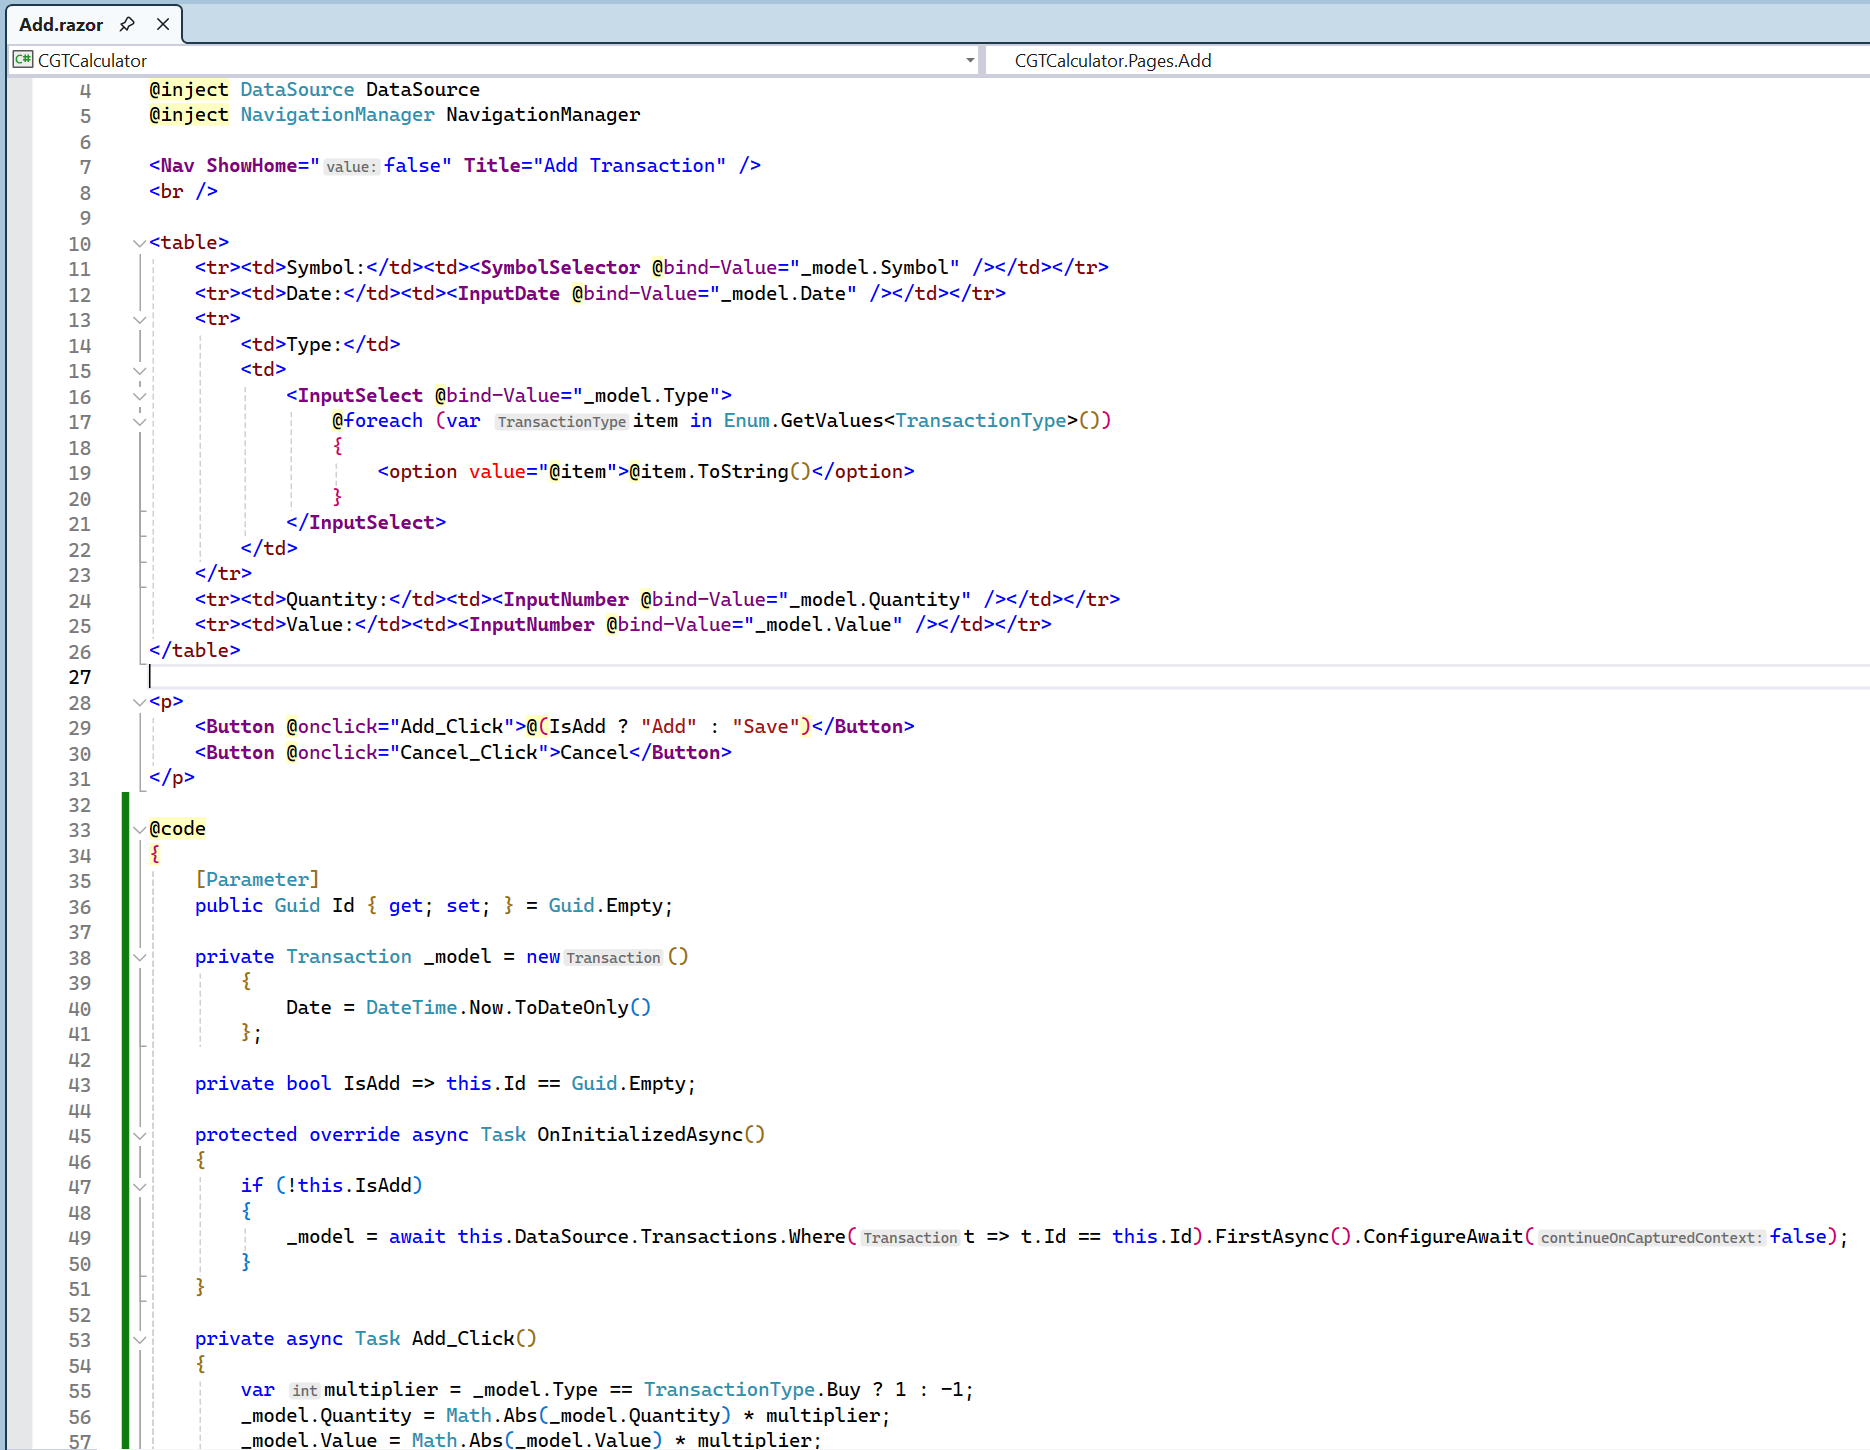
You can now enable inlay hints for C# code in your Razor (.razor, .cshtml) files. Inlay hints display parameter names for literals and object instantiation inline with your code. Inlay hints can also display type hints for variables with inferred types (i.e. var) and lambda parameter types. This feature can be enabled via Tools > Options > Text Editor > C# > Advanced.
Code Search and Navigation
In All-in-one Search, we’ve made some changes to simplify the UI and improve readability. These changes include the removal of highlighting of matches in the query, removal of the status bar with counts of each result type, and move of the status messages to the filters row.
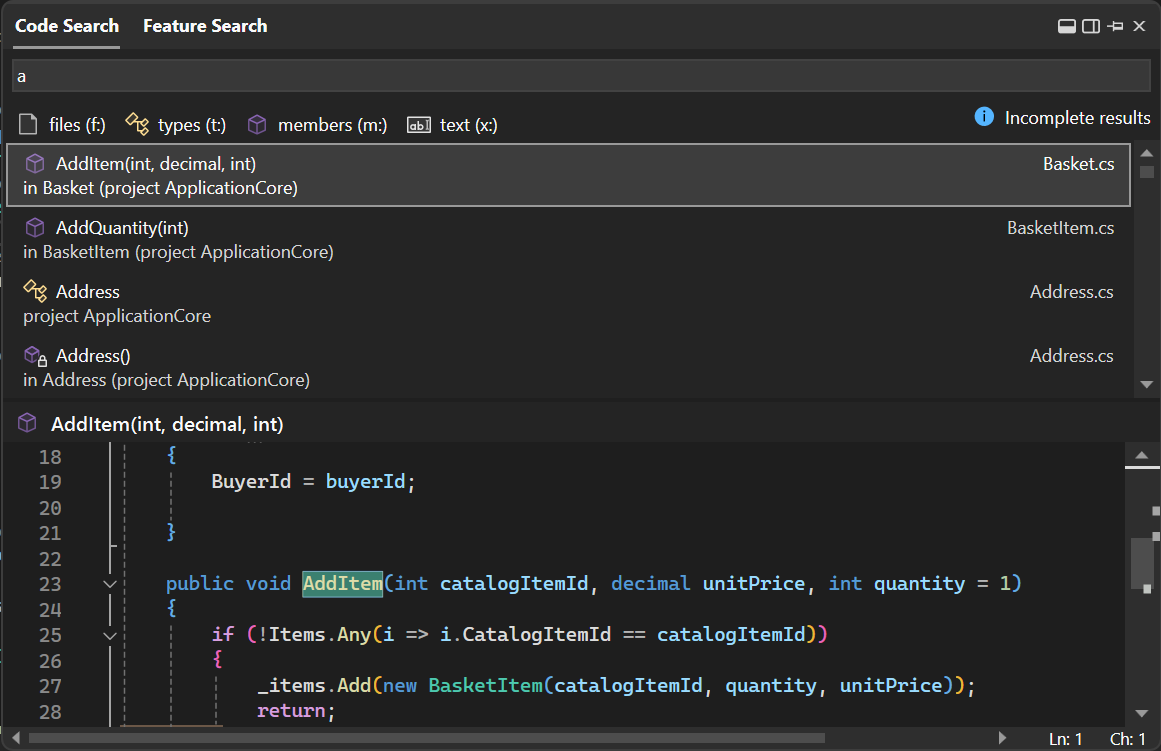
Let us know what you think on Developer Community.
Improve the readability of Visual Studio with new text formatting options
We've addressed Italic Font Support in Visual Studio 2019, bringing Italic, strikethrough, and underline as additional options for text formatting thoughout the IDE.
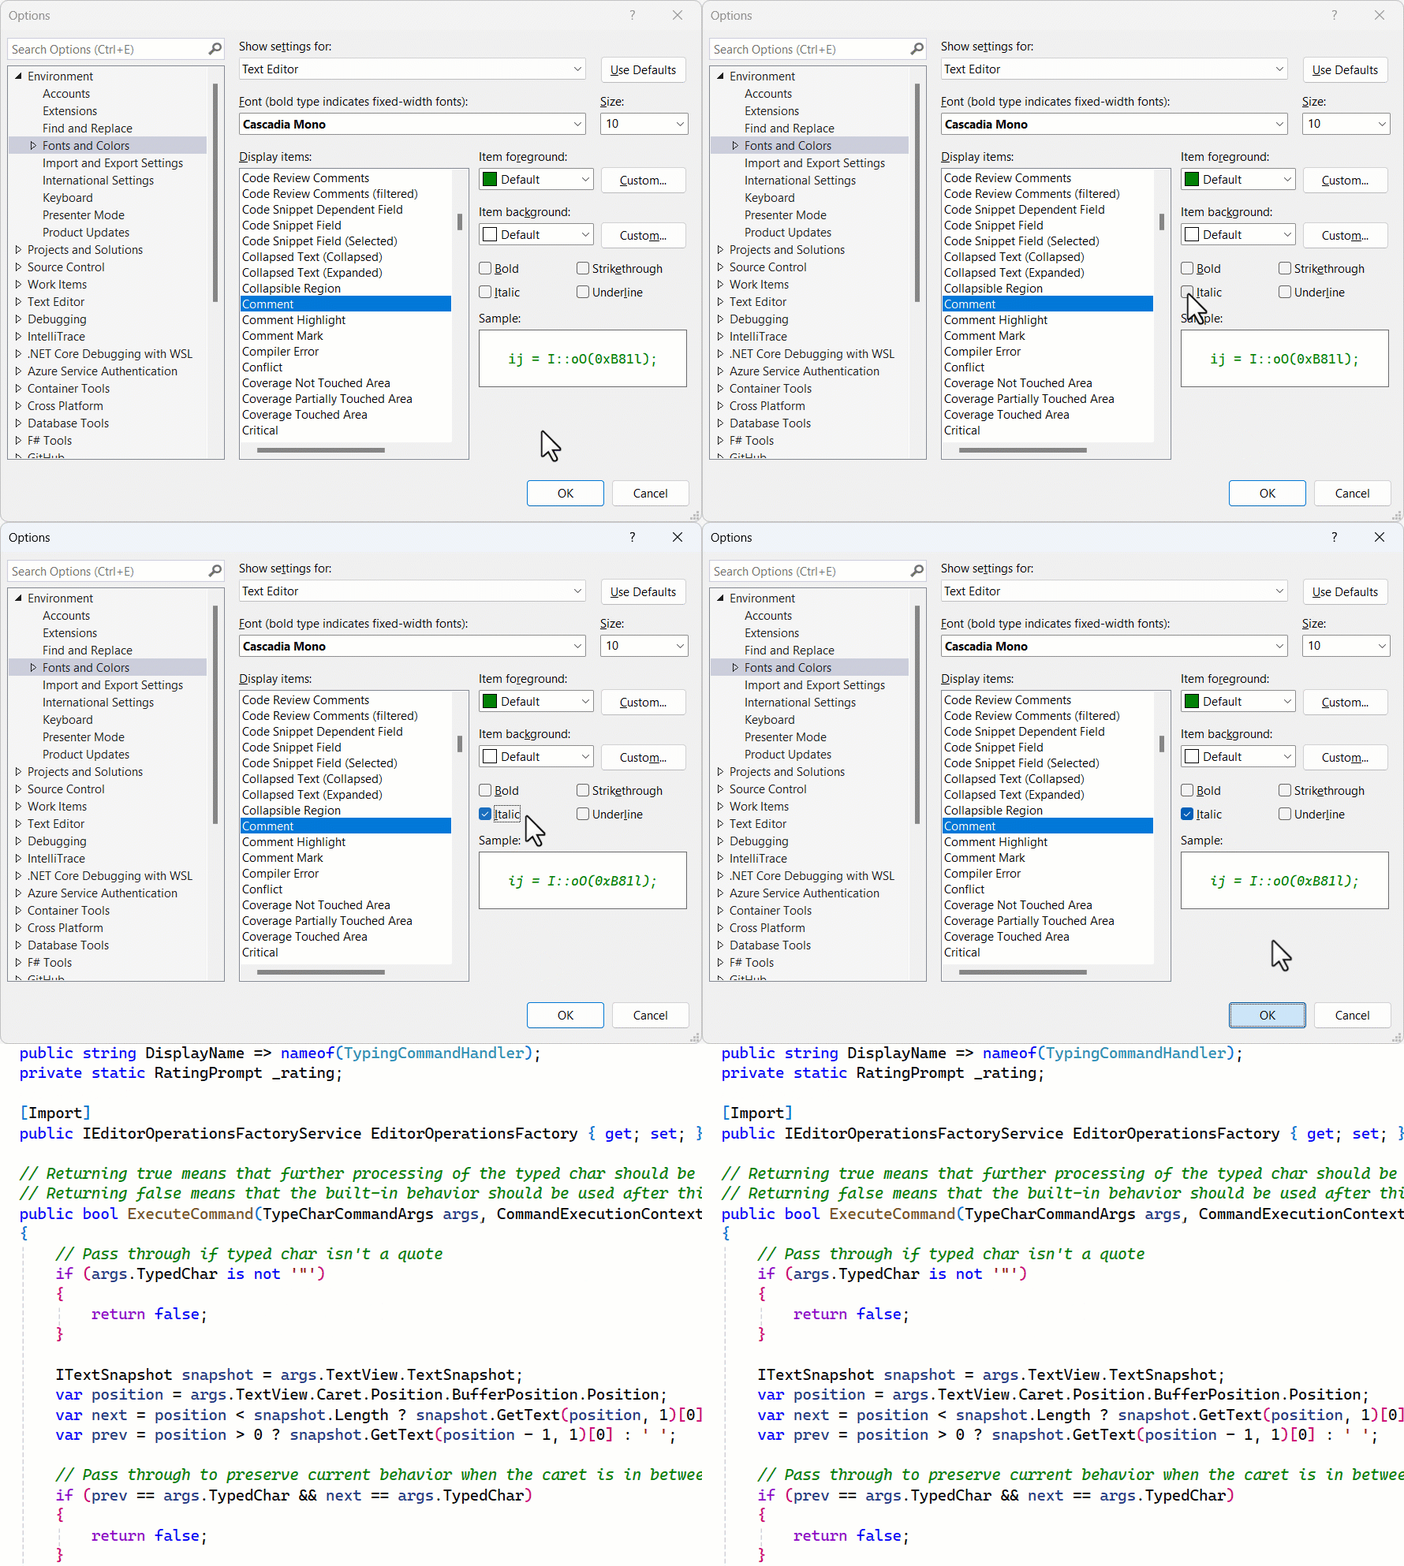
To use the new options to personalize your experience, navigate to the "Fonts and Colors" page in Tools > Options > Environment where you'll find checkboxes for each of the previously mentioned options.
Image Hover Preview
Any web, desktop, or mobile developer works with images often. You reference them from C#, HTML, XAML, CSS, C++, VB, TypeScript, and even in code comments. Some images are local, and some exist online or on network shares, while others only exist as base64 encoded strings. We refer to them in numerous ways in code, but always as string values that don’t show us what the image looks like. Until now.
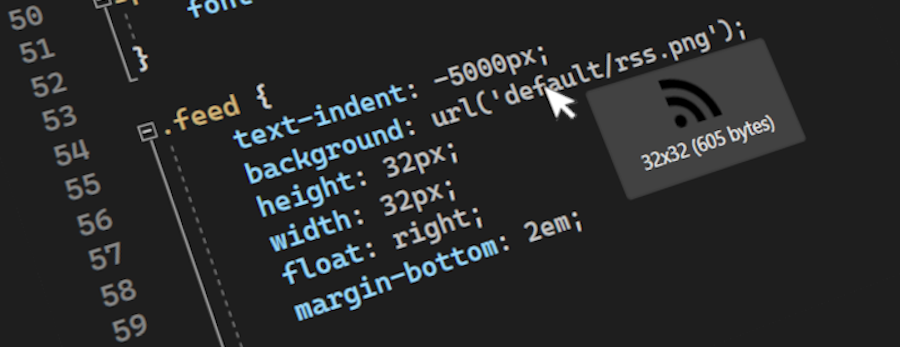
We’ve included an editor tooltip that shows up when the mouse hovers over an image reference in the code editor. The tooltip shows the image in its original size but capped at maximum of 500 pixels wide and high. Below the preview image you’ll see the size in pixels and the file size in bytes. This feature was developed in close collaboration with the Visual Studio community. Thank you!
Windows Forms out-of-process designer
Performance improvements in Windows Forms out-of-process designer
Through a fruitful collaboration with a key partner, we are thrilled to announce substantial enhancements to the WinForms server process TypeResolutionService. These enhancements have yielded remarkable design time performance improvements, ranging from 30% to an impressive 50% in typical line of business applications. Notably, these enhancements particularly shine during scenarios that trigger server process restart and designer reload, such as project rebuilds or adjustments in project references. At the heart of these performance improvements lies a new mechanism implemented by our team, prioritizing assemblies crucial for designer load. We encourage you to explore the updated designer and share your invaluable feedback through VS Feedback channel so that we can continue improving WinForms designer performance.
SQL
SSDT is Supported in Visual Studio for ARM64
You can now create Database Projects in Visual Studio for ARM64. Some of the key features of SSDT that are available in this release are:
- Database Projects (Open, Build, Publish)
- Schema Compare
- Data Compare
- Query Editor
- Table Designer
- Database Properties Editor
- Object Refactoring
Some Limitation of this release are as follows:
- Debugger
- IntelliSense
- Database development in local machine using localdb
Support for MCD (Multi-Column Distribution) in SSDT
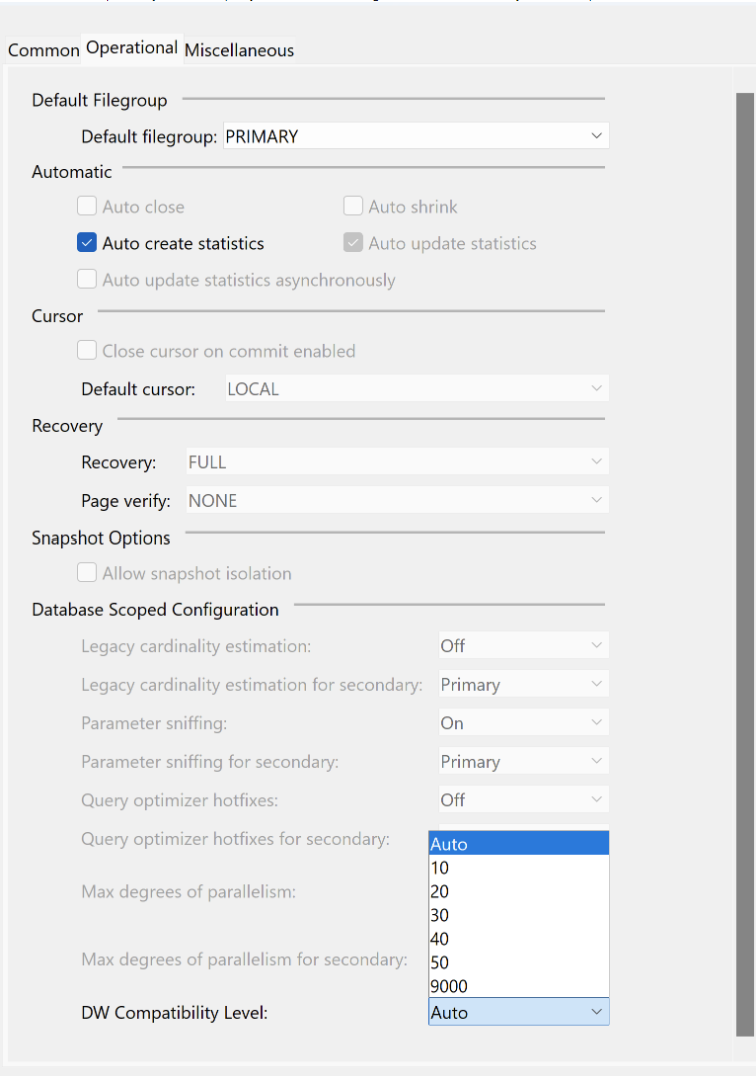
Users will be able to set the DW compatibility level during export now.
- We have added a new database option in the Database Settings under the "Operational Tab". It is named as "DW Compatibility Level".
- Possible values are Auto|10|20|30|40|50|9000 and it is only valid for Target - Microsoft Azure SQL Data Warehouse
Visual Studio Updates will now include Recommended Components
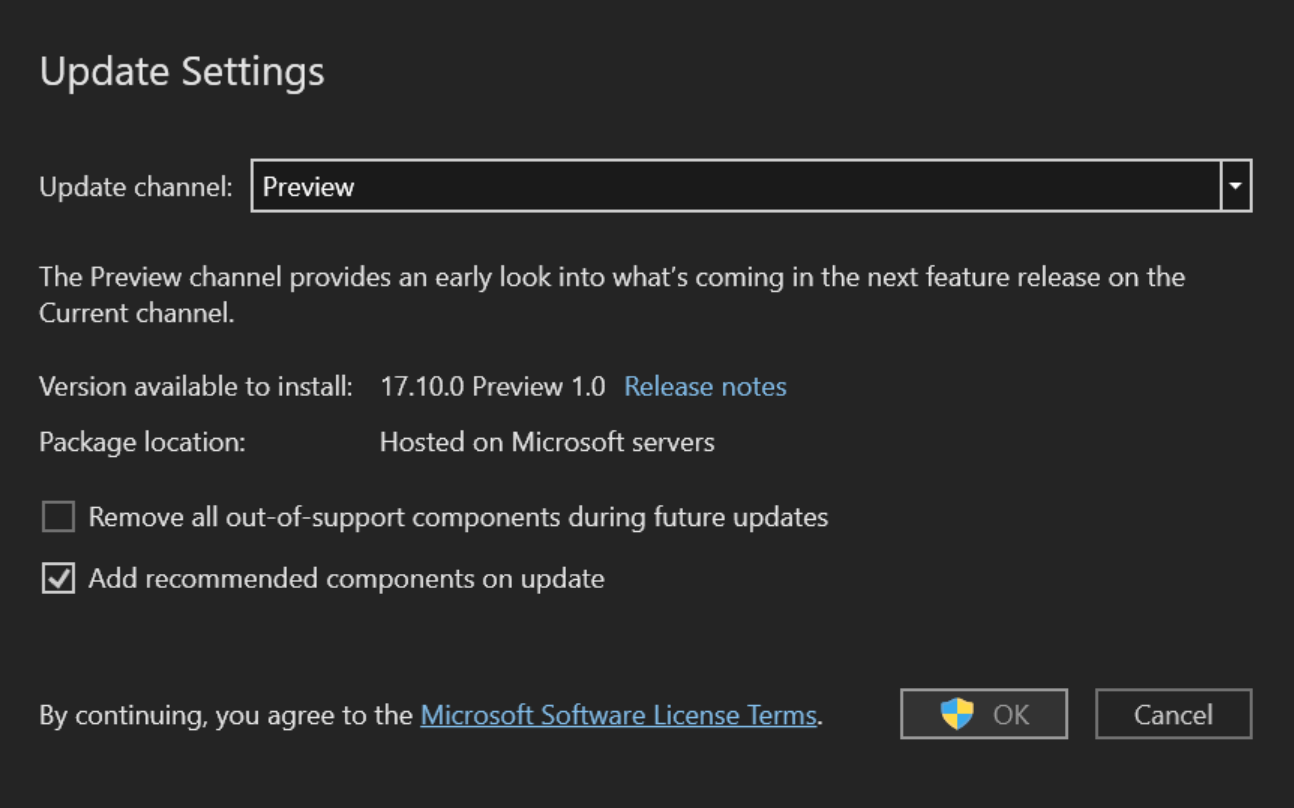
The workloads users select during installation come with required and recommended components. Required components are essential for the workload's functionality, while recommended components, though optional, play a crucial role in maximizing its potential.
Since the release of Visual Studio 2017, ongoing enhancements have been integrated into the IDE through minor version updates. These improvements enhance productivity and expand development capabilities, seamlessly integrated into both existing components and new ones. However, many users may not be aware of these new recommended components as they update incrementally. To address this, starting with 17.10 P1, Visual Studio will automatically install these new recommended components during updates. Notably, the recommended components installed during the update are only for workloads chosen by users.
Similarly, during updates, this feature ensures that no new workloads are installed. Additionally, any existing recommended components that users have chosen not to install remain untouched.
If you prefer not to use this feature, you can easily deselect it in the Update Settings dialog in the Installer. You can also remove recommended components if they're no longer necessary by modifying your installation.
For the list of all components in Visual Studio, including recommended components, see Visual Studio Component IDs
Improved detection of Android emulator performance impacts
Visual Studio will check for hardware acceleration when attempting to start the Android emulator and will display helpful dialogs explaining potential performance impacts. If your machine isn't configured or doesn't support hardware acceleration with the Windows Hypervisor Platform (WHPX), the Android Emulator hypervisor driver (AEHD) is now required. The Intel Hardware Accelerated Execution Manager (HAXM) is deprecated from Android emulator API level 33 and higher, and has been replaced by AEHD on Intel processors.
For more information, see How to enable hardware acceleration with Android emulators (Hyper-V & AEHD)
Linking work items to pull requests
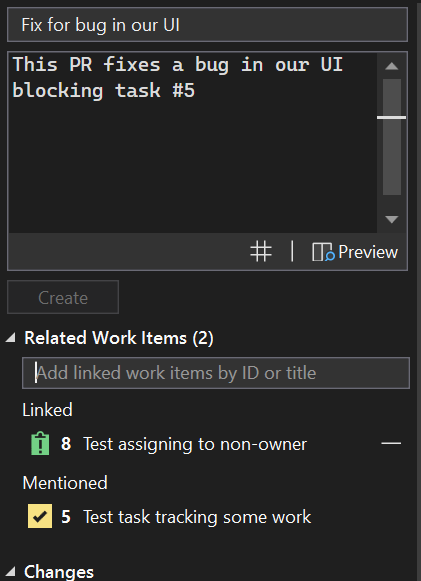
The number one request from Azure DevOps users when creating a pull request in Visual Studio was enabling work item linking. Now, you can use the Related Work Item section to view any work items you referenced in your pull request description and link work items to your pull request on Azure DevOps.
C++
- We have added support for pinning CMake targets in the CMake Targets View. There is a top-level folder now for Pinned Targets. You can pin any targets by right-clicking and selecting the
Pinoption in the context menu.
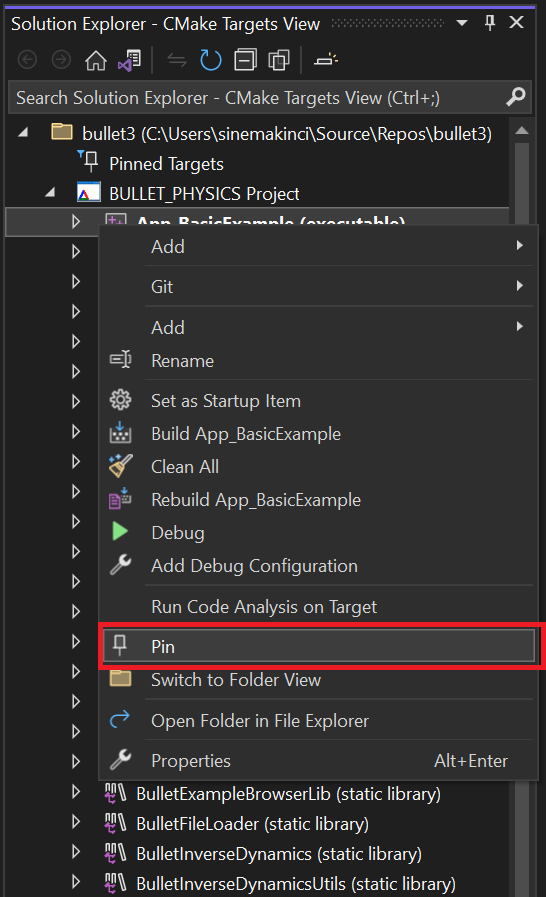
You can also unpin any target in the Pinned Targets folder by selecting Unpin.
The MSVC toolset will increment its minor version number from
19.39(VS 2022 v17.9) to19.40(VS 2022 v17.10). The MSVC toolset will be version 19.40.33521.0 in the preview 1 release. For more details, see the MSVC Toolset Minor Version Number 14.40 in VS 2022 v17.10 blog post.You can now use Build Insights to view your template instantiation information. Template instantiation collection must be activated in Tools > Options > Build Insights.

We have added additional Unreal Engine Macros to be indented in accordance with the UE Code Style.
You can now keep our Unreal Engine plugin needed for Unreal Engine Test Adapter running in the background, greatly reducing startup costs. This is an opt-in feature that can be activated via Tools > Options > Unreal Engine.
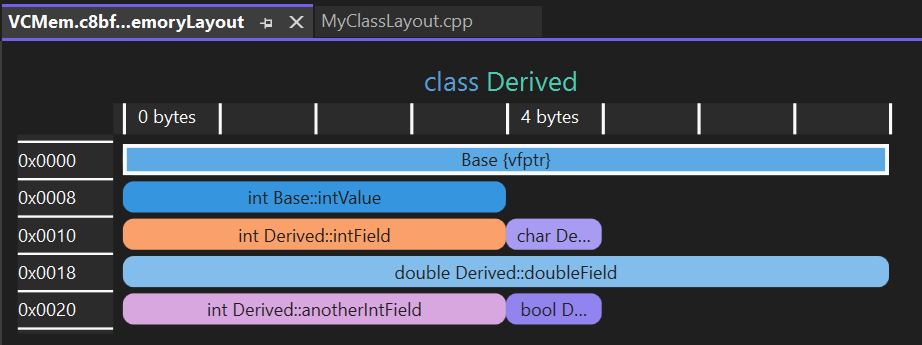
C++ Memory Layout Visualization
Visual Studio now has C++ Memory Layout Visualization feature. This feature displays the memory layout of your classes, structs, and unions within the editor, eliminating the need for compilation. A ‘Memory Layout’ link appears in the Quick Info when you hover over your types. Clicking this link opens a window showing the memory layout of the selected type, with details on size and offset of individual data types.
Win32 App Isolation
A groundbreaking security feature that enhances user privacy and application integrity. Built upon the foundation of AppContainers, Win32 App Isolation ensures that applications are sandboxed, providing a secure environment that limits the impact of potential compromises.
Developers can now easily isolate applications within Visual Studio, streamlining the process and improving the overall security posture of their projects. You can engage directly with the developer community and provide feedback on the new features and improvements.
Known Issues
- Users who have privilege management software from Delinea installed may experience issues launching Visual Studio. Delinea is aware of this issue and has addressed it. Please contact them through https://delinea.com/support to get instructions on how to resolve this issue.
- Source Control Dialog - Please see the ticket for a workaround to avoid seeing a dialog for "The source control provider associated with this solution could not be found."
- C++ users targeting UWP may hit a build error
Could not find SDK "Microsoft.VCLibs.Desktop, Version=14.0"due to missingC:\Program Files (x86)\Microsoft SDKs\Windows Kits\10\ExtensionSDKs\Microsoft.VCLibs.Desktopfolder. See the ticket for details and workarounds. This issue is being prioritized. (updated May 29th, 2024: This is fixed as of the 17.10.1 release). - C++ users building managed MFC DLLs may hit a build error
error LNK2001: unresolved external symbol "public: __cdecl PostDllMain::PostDllMain(void)". See the ticket for details and workarounds. This issue is being prioritized. (updated May 29th, 2024: This is fixed as of the 17.10.1 release). - An optimization in the C# compiler lead to comparisons between decimal? value that is null and decimal value that is 0.00m incorrectly being considered equal. Additional details are available at the .NET Compiler repo.
- A recent update made to an underlying Windows component has caused a breaking change to the Diagnostics Tools window which in turn impacts the Profiler tools. This impacts all Visual Studio 2022 versions. Additional details and the latest updates can be reviewed on the Developer Community site.
Note
This update may include new Microsoft or third-party software that is licensed separately, as set out in the 3rd Party Notices or in its accompanying license.
Feedback and suggestions
We would love to hear from you! You can Report a Problem or Suggest a Feature ![]() by using the Send Feedback icon in the upper right-hand corner of either the installer or the Visual Studio IDE, or from Help > Send Feedback. You can track your issues by using Visual Studio Developer Community, where you add comments or find solutions. You can also get free installation help through our Live Chat support.
by using the Send Feedback icon in the upper right-hand corner of either the installer or the Visual Studio IDE, or from Help > Send Feedback. You can track your issues by using Visual Studio Developer Community, where you add comments or find solutions. You can also get free installation help through our Live Chat support.
Blogs
Take advantage of the insights and recommendations available in the Developer Tools Blogs site to keep you up-to-date on all new releases and include deep dive posts on a broad range of features.


